


It is well known that the grain sizes and phase distributions in the microstructure of casting are the important factors to be considered when a good surface finishing is essential and/or desired.
 Anne Deacon Juhl, M.Sc., Per Møller, Ph.D., Leif Højslet Christensen, Ph.D., Lars Feldager Hansen, M.Sc. Missing: Preben Nordgård Hansen, Ph.D.These microstructures can change over various parts of a casting. "Surface metallurgy" will, therefore, be introduced in order to characterise the microstructure near the surface of cast aluminium alloys. Employing a numerical simulation of the solidification of the casting and comparing it with the surface metallurgy, a new method for achieving on improved casting surface for surface finishing technology is established, i.e. "Casting for Surface Treatment".
Introduction
Aluminium can be cast by practically any method generally accepted by foundry men. When pressure die casting is selected a smooth surface is obtained, but even then the surface finishing may not be as uniform as wanted. The metallurgy in the "as cast" item is different when different casting techniques are used, but even in the same casting differences appear. These differences are caused by the variations in solidification and cooling rates across the casting. Therefore, control of the casting is of great importance in order to obtain a proper surface for surface finishing .
Pressure Die Casting
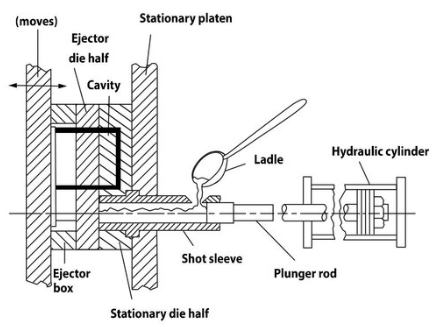 Figure 1: Diagram of the cold chamber process.1Pressure Die Casting is a process where molten metal is pressed under high pressure into a permanent mould. The process can be compared with chill casting as they both use a permanent mould. In chill casting the gravity will fill the mould, while pressure die casting uses pressure to fill the mould. The very high pouring rate makes it possible to cast very complex and thin castings and at the same time pressure die casting makes it possible to cast a large number of parts in a short time.
A normal pressure die casting cycle takes in general about 30 seconds for small parts and up till 4-5 minutes for big parts. This results in very high cooling rates, which causes a fine microstructure and a smooth surface.
Figure 1 shows the essential features of the cold chamber process. In this process the melt is placed outside the casting system. The melt is poured into the pouring hole and the plunger presses the melt in the direction of the mould (die). While metal is solidified in the mould, the rest of the molten metal is liquid under high pressure. This is done for two reasons; 1) for compensation of the lost under solidification, and 2) for having the opportunity to press the porosity "out" causing a more dense casting.
During pressure die casting the heat transfer is fast, the solidification rate is high (solidification time low) and the microstructure will be fine due to a great undercooling. Such solidification rates are found at small distances from the surface of the mould, in thin sections, or at laser-remelted surfaces.2
Without a certain undercooling no nucleation or crystallisation will occur. At the same time, the state of undercooling, and by this nucleation ability of a melt, will determine the type of microstructure formation.3
A different situation prevails when the solidification rate is low (solidification time high). Here the heat transfer is low and the nuclei will continue growing and therefore the microstructure will be coarse-grained. Such microstructures are found in the central part of the mould and in thick sections.
Microstructure
It is obvious that the state of the surface is most important for the result of surface finishing, both regarding what kinds of intermetallic phases are present and how their size and distribution are.4,5
The form of the microstructure depends not only upon the heat transfer but also upon the alloy composition.6 The two major growth types of a casting are the dendritic and eutectic. Both types of microstructure are present in almost every casting because of the better castability of a near-eutectic or eutectic alloy than that of any other compositions.
Pinner et al.4 show the importance of the choice of alloys when aluminium alloys are surface treated. The content of alloying elements should not vary much, before an unsatisfactory result is obtained.
Anodic coatings formed on pure aluminium (0.05% impurities) are continuous and transparent transmitting light through thin section of the oxide coating. In coatings formed on aluminium containing 0.8% impurities dark-coloured areas are obtained. These areas contain particles of constituent and oxidation products that detract the transparency of the coating.5 This indicates how important or rather detrimental impurities (= constituents of an alloy) are to the finish.
The distinct phases in alloyed aluminium behave differently, when anodised.5
- Si: does not oxidise or dissolve
- CuAl2: oxidises or dissolves more rapidly than Al
- b-AlMg: oxidises or dissolves more rapidly than Al
- FeAl3: partly dissolves and partly remains in the coating
This is due to the chemical composition and electrolytic behaviour of the constituents in the solution. Silicon is not oxidised or dissolved under the anodising process and will be fund at the same relative position as before the surface finishing process. There are some disagreements about the behaviour of the other phases.4
Table 1, The potential of some intermetallic and solid phases.7
| Phase | Potential (mV) |
| Mg2Al3 (Mg5Al8) | -1240 |
| Al+7% Mg | -890 |
| Al+3% Mg | -870 |
| 99.95% Al | -850 |
| Al+1%Mg2Si | -830 |
| Al +1% Si | -810 |
| Al+2% Cu | -750 |
| CuAl2 | -730 |
| FeAl3 | -560 |
| Si | -260 |
Looking at the potentials (Table 1) measured in a solution containing 53 g NaCl/l and 3 g H2O2/l at 25°C, with reference 0.1 N Calomel electrode7, the phases CuAl2 and FeAl3 might not oxidise because of the more noble potentials of these compared with the pure aluminium.
The difficulty with these potentials is that they have not been measured in the electrolyte used for anodising, but they may still give some indications of the electrolytic behaviour of the phases.
Quantitative Microscopy
The microstructure of alloys can be revealed using light microscopy, scanning electron microscopy (SEM), and x-ray microanalysis (EDX). However, most often the information obtained has been qualitative restricting a comparison to be a visual comparison of a limited number of micrographs.
Computer-assisted microscopy8 provides a number of tools for quantifying the microstructure, and, thus, provides the basis for a fully quantitative comparison of data from a number of specimens. Stage automation and computer controlled microscopes allow acquisition of a sufficient number of digital micrographs to make the comparison statistical unbiased.
Surface Metallurgy
The metallurgy of the outermost surface layer, which will be exposed to the surface treatment, needs to be known and possible controlled to obtain a good and reproducible surface finishing. The surface layer should be characterised in terms of the identity of intermetallic phases, their size and spatial distribution.
Numerical Simulation
By numerical simulation of the casting process3 the solidification rates over different parts of the casting, temperature - time curves at different places in the casting, the pouring time, the filling sequence and many others casting parameters can be simulated by this program. A dramatic improvement in the quality, productivity and technical properties can be obtained when modern computer technology is used to optimise the casting.
This paper presents a new method, named "Casting for Surface Finishing" (CSF). By linking together the casting simulation, the surface metallurgy, and the resulting finishing a method to prepare cast aluminium parts is obtained. Preliminary results of our work are presented.
Experimental
The casting was part of a carburettor and the alloy used was SIS 4250 (AlSi9Cu3). The casting process was a cold chamber pressure die casting, where the melt was placed outside the casting system.
The casting was DC anodised in 15 (W/W)% H2SO4, 20°C, ia = 2 A/dm2, 40 minutes.
The composition (% wt) of alloy SIS 4250 was as follows:
| 8-11% Si | 2-3.5% Cu |
| 0.1 - 0.5% Mg | ≈ 0.8% Fe |
| ≈ 1.2% Zn | ≈ 0.1 - 0.5% Mn |
| ≈ 0.3% Ni | ≈ 0.15% Ti |
| ≈ 0.1% Sn | ≈ 0.2% Pb |
| Bal. Al |
The two samples were taken from the carburettor. The positions of the samples are marked in figure 2. The thickness of sample I is 3 mm and that of sample II 15 mm.
The samples were prepared metallographically as cross sections perpendicular to the anodised surface. The samples were etched in Weck colour etchant prior to the light microscopy work.
The numerical simulations were carried out using the software package MAGMAsoft.
The SEM/EDX work was carried out on a Cambridge S360 microscope equipped with a Link AN10000 EDX system. The working magnification was 1.000X giving a field of view of 100 mm x 100 mm. Backscatter images and x-ray elemental maps were acquired under computer control along the oxide layer. With a grid size of 128 x 128 the "point" resolution is approximately 1 mm2. For each point a 100 ms x-ray spectrum was obtained providing statistical valid information for the elements Al and Si.
The backscatter image and the elemental images for each field of view were subjected to off-line image processing and graphical presentation.
Results
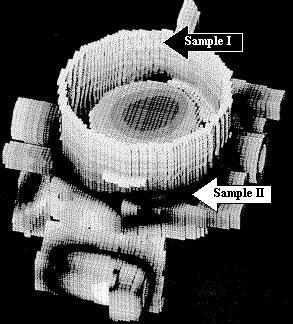 Figure 2: The simulated solidification time for the casting, 100% filled.Figure 2 shows the solidification times of the casting when the mould is totally filled. In the dark areas the solidification time has been slow and in the light areas it has been fast.
Before simulation the complete geometry of the casting should be included in the program. After this an enmeshment is accomplished which permits a coarse or a finer discretisation of the casting volume. In the actual casting 250.000 elements have made the enmeshment.
After anodising, the colour of the oxide layer varied over the casting. Where the dark areas are seen in figure 2 (slow solidification time), the oxide layer had a darker colour than in the areas where the solidification time was fast.
In sample I the solidification time was 1.44 seconds after 100% filling of the mould. In sample II the solidification time was 7 - 8 seconds after 100% filled.
The solidification time in sample I was short because of the high solidification (cooling) rate due to the thickness of the part, which is very thin. The solidification has happened immediately, with a large undercooling and by this the microstructure near the surface is fine. Nucleation rate has been high and the growth rate low.
 Figure 3: Sample I, showing the fine eutectic, Light microscope 250XThe cooling rate was lower in sample II. Here the same microstructure was obtained, but the grains should be more coarse. Here it is due to the dimension of sample II, which is expected to make the solidification time longer than in sample I, and, thus allowing the microstructure to grow in size.
Figure 3 shows the micrograph of sample I. The thickness of the layer is approximately 5 mm and the microstructure consists of primary aluminium and a fine eutectic.
Looking at the aluminium - silicium phase diagram under equilibrium conditions, figure 4, the silicium can be found in three ways:
- Soluted in aluminium: The white areas in figure 3 are the primary a-crystals formed, when the liquidus/solidus line is reached. The primary aphase represents solid aluminium with up to about 1.65 % Si in solid solution.
- As Si crystals in the eutectic: The eutectic between the primary a-crystals consists of primary a-crystals and silicon crystals, formed when the eutectic temperature is reached.
- As primary Si-crystals when the alloy is hypereutectic: The alloy used is not hypereutectic, which is why no primary Si crystals are present.
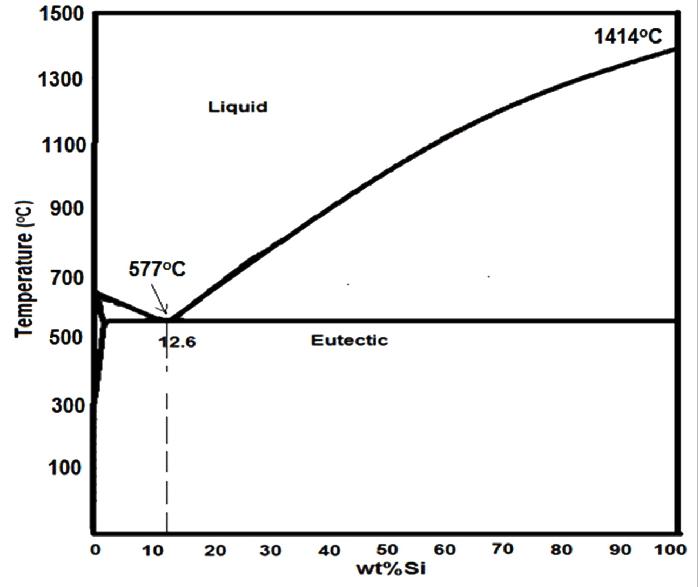 Figure 4: Phasediagram Al-Si.Silicon is found as silicon in solid solution and ín the eutectic in this alloy.
During solidification segregation of intermetallic compounds is possible. The alloy contains copper, magnesium, manganese, iron and other elements, giving the possibility of many different phases. CuAl2, Mg2Si, FeAl3, MnAl6 are some of the conceivable phases in the alloy SIS 4250. These phases will also be fine because of the high solidification rate, but they are difficult to see in the figures. In this paper they will not be taken into account, but in future work their influence on the surface finishing will also be estimated.
Figure 5 shows the micrograph of sample II. In this case the thickness of the oxide layer is approximately 25 mm.
In this preliminary work micrographs from the light microscope have not been subjected to image processing. In general the microstructure is very complex. However, we anticipate that some image colour processing will be possible after refinement of the etching procedure. For the moment we will confine ourselves to a qualitative discussion of our findings.
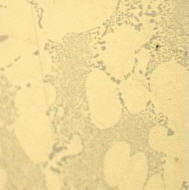 Figure 5, Sample II showing the coarse microstructure, Light microscope 250X.The silicon crystals in the eutectic are perhaps a bit different in the two samples but it is not easy to see. The structure in sample II looks more fine grained than the one in sample I. This does not agree with the above explanation. At the same time it can be difficult to explain the differences in the thickness of the oxide layer by the difference in the microstructure.
It is also known that the solidification starts already in the cylinder because of the lowering of the temperature when pouring the melt into to the mould. The melt therefore contains a certain amount of nuclei before reaching the final place. This leads to the necessity of a much smaller undercooling because of the growth on the nuclei already formed. This can explain the fine microstructure obtained in sample II in spite of the fact that this microstructure should be coarse because of the low solidification rate.
The aluminium x-ray images were subjected to image processing. Based on the image analysis the phase distribution of the a-crystals and the eutectic were quantified. Normally the results are presented as colour coded images showing the variation in elemental composition across the field of view. In this paper the results are shown as greytone images, figure 6.
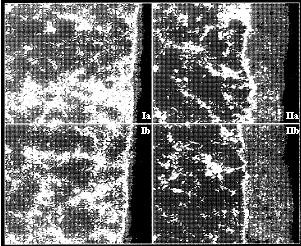 Figure 6: X-ray images for Al as seen in two fields of view (left side sample I; right side sample II)The black areas in the metal phase represent the highest amounts of aluminium. The greytone of the oxide layer does not correctly indicate that this part contains the lowest amount of aluminium.
The white edge seen along the oxide layer is due to lack of resolution in the x-ray measurement.
The images Ia and Ib show sample I. The oxide layer, which appears on the right side of sample I is, as already told, 5 mm. By comparing it with sample II, image IIa and IIb on the right side, where the oxide layer is 25 mm, the difference in the bulk material is obvious. The white phase is the eutectic and the black phase is the primary a-crystals in both samples.
In figure 6 the images of sample Ia and Ib show the difference in the distribution of the eutectic in sample IIa and IIb. The eutectic is much finer distributed in sample I than in sample II.
This fine and dense distribution of the Si-rich eutectic contributes to a surface in sample I which has a higher potential than sample II. At the same time there will be more silicon in the a-crystals in sample I compared to sample II due to a higher solidification rate.
Due to that the current will flow against sample II instead of sample I. The higher current in sample II will cause the solution of the aluminium to be higher, and, thus the oxide layer will be thicker.
Conclusion
The conclusion of the paper is, that the finishing of a surface is strongly related to the metallurgical development of the casting:
Solidification → Microstructure → Surface finishing (application/properties)
To obtain a high quality of surface finishing a good surface is necessary. This kind of surface can only be produced if the surface metallurgy is known. This leads to the importance of being able to produce an appropriate microstructure. The possibility of controlling the microstructure lies in the casting process.
The MAGMAsoft program, simulate filling and solidification of the casting and gives therefore the possibility to fulfil the necessary conditions. Not only the electrochemical properties (important in anodising) but also other technical properties can be improved by using the casting simulation program to decide the optimal microstructure.
The casting in this investigation is complex. The thickness of the oxide layer varied much over the parts of the casting. The thickness of the oxide layer should have been about 15 mm but it varied from 5 - 40 mm.
A thick oxide layer was expected on sample I because this part was close to the cathode during the anodising process. Sample II was much further away from the cathode, so here it would be expected that the oxide layer was very thin. This is opposite to what was observed for the two samples. This is properly due to the finer distribution of silicon in sample I compared to sample II caused by a higher solidification rate.
A high content of silicon increases the anodising voltage and by this the current will flow more easily to sample II. The dissolution of the matrix metal will, therefore be faster on sample II than on sample I and thus make the oxide layer thicker on sample II.
Our results show that there is a correlation between solidification, microstructure and the result of the surface finishing. Still more work is needed before the CSF method can be used in common practice.
Written by Anne Deacon Juhl, M.Sc. and Per Møller, Ph.D., Centre of Advanced Electroplating (CAG), Technical University of Denmark, Building 425, DK - 2800 Lyngby; Leif Højslet Christensen, Ph.D., Department of Chemistry, Danish Technological Institute, DK - 2600 Tåstrup; Lars Feldager Hansen, M.Sc and Preben Nordgård Hansen, Ph.D., Lab. of Thermal Processing of Materials, Technical University of Denmark
Acknowledgement: The authors wish to express their gratitude for the valuable discussions with E. W. Langer and G. Bech-Nielsen.
References
- Semi-Automated Gating System Design With Optimum Gate And Overflow Positions For Hpdc, PhD Thesis By Mohamed Refaat Aboel-fotouh El-Basyony, 2018
- Flemings, M. C., Solidification Processing, McGraw - Hill, New York, 1974.
- Sahm, P. R. and Hansen, P. N., Numerical simulation and modelling of casting and solidification processes for foundry and cast-house, CIATF, 1984.
- Werncik, S., Pinner, R. and Sheasby, P.G., The Surface Treatment and Finishing of Aluminum and its Alloys, 5. Ed., ASM, Ohio, 1987.
- Keller, F. and Edwards, J.D., Performance and Structure of Anodic Coatings On Aluminum, p. 75 - 78, The Iron Age, November 22, 1945.
- Fisher, K., Fundamentals of solidification, 3. Ed., Trans Tech Publications, 1989.
- Van Horn, K. R., Aluminium, Vol. III American Soc. for Metals, 1967.
- Russ, J. C., Computer-Assisted Microscopy, The measurement and Analysis of Images, Plenum Press, 1990.