


Extensive salt fog testing (up to 1,000 hr) is required to predict how well a coating will protect a base metal but the correlation with real-world performance is poor. Electrochemical testing takes only a few hours and can predict how well a coating will perform in both salt fog and real-world applications.
A robust correlation between electrochemical testing and salt fog performance was found and quantified for a trivalent chromium pretreatment (TCP) coating on aluminum alloy 2024-T3. The purpose of this work is to link electrochemical analysis to neutral salt fog testing for process testing and future real-world application performance prediction.
Preventing corrosion on aluminum alloys
Aluminum alloys have an overall matrix composed of aluminum, which is mixed with various other metals to enhance performance. Some metals will be distributed throughout the aluminum matrix more evenly (such as Zn and Cr) while others (Cu and Mg) tend to aggregate into clusters together, called intermetallic particles (IMPs), see Figure 1.
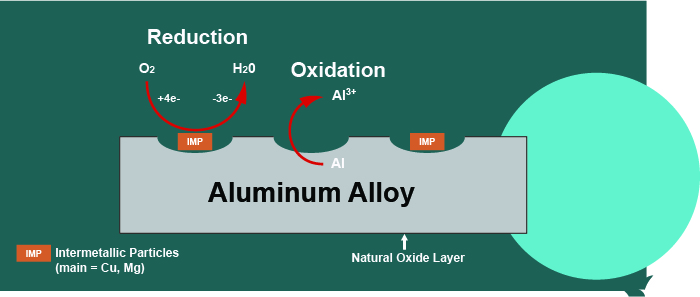
Figure 1 - Corrosion mechanism on 2024 aluminum alloy.
If the IMPs contain copper (2000 series), they will behave as active sites which promote oxygen reduction. This leads to increased aluminum oxidation in the nearby aluminum matrix. Aluminum oxidation forms aluminum cations which leave the matrix, causing damage to the base metal. To prevent this corrosion, the metal is covered with a barrier layer of conversion coating, which prevents any reactions on the surface.
Salt fog and electrochemical measurement
Salt fog testing
Salt fog testing protocol is followed according to commercial and military specifications: ASTM B-117, MIL-DTL-5541 and MIL-DTL-81706. Panels were tested to failure (i.e., one panel with >5 pits or >15 pits over five panels exposed) and the exposure time in salt fog and the number of pits at failure were recorded.
Electrochemical analysis
A standard three electrode cell was used in this test. The working electrode is the test sample, 2024-T3 aluminum alloy with CHEMEON TCP-HF conversion coating. A saturated calomel electrode (SCE) is used as a reference, while a carbon rod is used as a counter electrode. The electrolyte in the cell is either a 1.0M NaCl solution or a 10 vol% Harrison’s solution (undiluted solution is 3.5 wt% ammonium sulfate plus 0.5 wt% NaCl in water). The test is run inside a Faraday cage to prevent electrical noise interference. Measurements use a Gamry*** potentiostat and curve fitting software.
There are three electrochemical methods employed in this work, each providing a unique measurement to be used for corrosion evaluation. They are:
- Open circuit potential (OCP)
- Electrochemical impedance spectroscopy (EIS)
- Tafel
Experimental plan
Our experimental plan is based on the understanding that more aggressive pretreatments cause poor coating formation and performance. Thus, we sought a full comparison of the best and worst practices with an aggressive pretreatment. Here, an iron-based deoxidizer offers a more aggressive pretreatment than typically recommended. Accordingly, the results for the best process would be indicated by the longest salt fog time to failure with the least pits. The worst process would produce the shortest salt fog time to failure with the most pits. Once these results were established, the goal was to link the best and worst performing processes (via salt fog testing) to their electrochemical behavior, which would be expected to show the same trends and rankings.
Test panel preparation
Four processes, here referred to as T1, T2, T3 and T4, were evaluated in salt spray, and via the three electrochemical tests outlined above. Five panels of each process type were subjected to salt fog.
The aluminum panels were prepared according to the following protocol:
- Alkaline cleaner
- Double water rinse
- Iron-based deoxidizer
- Double water rinse
- Trivalent chromium conversion coating
- Short DI water rinse
A 24-hour cure time (ambient temperature away from coating line) occurred before salt fog or electrochemical testing
Results
Salt fog
The ranking of the process performance in salt spray is (best) T2 > T1 = T4 > T3 (worst). This ranking serves as the benchmark for comparison.
Open circuit potential (OCP)
The results for OCP measurements in 1.0M NaCl solution are shown in Fig. 2. Less negative values correspond to greater corrosion resistance. The results in Fig. 2(a) reflect the average for three test samples. These measurements are in accord with the salt spray rankings (T2 > T1 = T4 > T3).
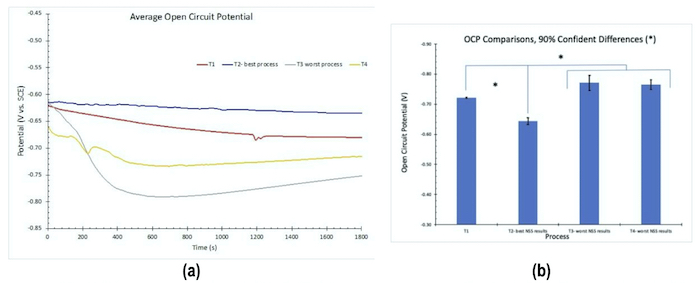
Figure 2 - OCP measurements: (a) average open circuit potential (n=3) versus time to 30 min; (b) average OCP comparisons.
Electrochemical impedance spectroscopy (EIS)
The results for EIS measurements in 1.0M NaCl solution are shown in Fig. 3. The results in Fig. 3(a) reflect the average for three test samples. The larger diameter of the Nyquist plot circle, the greater the polarization resistance, and thus the corrosion resistance. As with the OCP results, these measurements are in accord with the salt spray rankings (T2 > T1 = T4 > T3). Figure 3(b) compares the coating capacitance values, which agree well with the salt spray rankings.
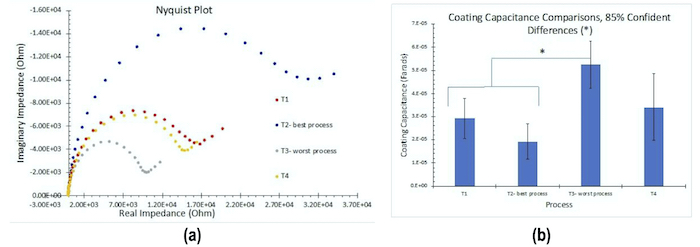
Figure 3 - Nyquist plots: (a) Nyquist impedance plots (n=3); (b) coating capacitance comparisons.
Tafel measurements
The results for Tafel measurements in 1.0M NaCl solution are shown in Fig. 4. The results in Fig. 4(a) reflect the average for three test samples. The lower the current flow, the higher the corrosion resistance. As with the other electrochemical measurements, the results of the corrosion “plateau” portion of the curves are in accord with the salt spray rankings (T2 > T1 =T4 > T3). The open circuit current clearly shows the T2 process to be superior. The Ecorr results confirm the two worst processes, T3 and T4.
Figure 4 - Tafel Plots (a) average Tafel curves (n=3); (b) corrosion potential comparisons.
Conclusions
All electrochemical measurements lined up well with the benchmark salt spray performance. The open circuit potential (OCP) measured most positive for the best process and most negative for the worst. For the electrochemical impedance spectroscopy (EIS), polarization resistance was highest for the best process and lowest for the worst, while coating capacitance was lowest for the best process and highest for the worst. In the Tafel study, corrosion current was lowest for the best process and highest for the worst, while the corrosion potential was most positive for the best process and most negative for the worst. The electrochemical measurements (specifically the polarization resistance and open circuit potential) could better differentiate between processes than salt spray, particularly when using the alternative Harrison’s solution electrolyte.
Dr. Sjon Westre is Senior Vice President of Technology at CHEMEON Surface Technology, based in Minden, Nevada. Dr. Catherine Munson is a research chemist at CHEMEON. Visit https://chemeon.com/.