


The susceptibility of Mg to corrosion is a major factor limiting its widespread use in applications including lightweight automotive and aircraft components, battery and fuel cell electrodes, and biomedical implants.1–5
 Michael P. Brady, Donovan N. Leonard, Elizabeth A. McNally, Joseph R. Kish, Harry M. Meyer III, Ercan Cakmak, and Bruce Davis.Alloying has only proven moderately effective to date for improving Mg corrosion resistance, although recent strategies involving alloy additions designed to poison the cathodic reaction (e.g. As or Ge) or form surface films other than MgO/Mg(OH)2 (e.g. Li2CO3 formed on Mg-Li alloys) hold promise for further improvement.6–12 Modified processing routes (e.g. rheocasting or metastable alloying via techniques such as sputtering or high entropy alloy design strategies) also have potential to improve corrosion resistance.9,10,12 However, in many applications protective coatings will be critical to the successful adoption of Mg alloys.
Corrosion protection of structural Mg components is typically approached with multi-layer coating schemes.13–17 These include an initial surface pre-treatment with chemical or electrochemical conversion coatings, surface alloying, or anodization primarily to improve adherence of subsequent coating layer(s), although they can also contribute to corrosion resistance; a second coating layer such as epoxy-base electro-deposition coatings, metal electro-platings, powder coatings, or organic coatings primarily to provide corrosion protection; frequently followed by a final layer(s) of sealant and/or paint to provide additional corrosion protection.13–25 Plasma electrolytic oxidation (PEO), also referred to as micro-arc oxidation, is emerging as a key coating technique for the protection of Mg alloys, and is being investigated both as a single-coating in less-demanding environments and as the initial surface pre-treatment of a multi-layer coating system in more demanding environments.26–50
In the PEO process, the metal component to be coated is immersed in a liquid electrolyte and a high applied potential promotes chemical, thermal, and plasma reaction(s) to form ceramic surface layers(s) from the base metal.27,35,38 The resultant coating can therefore be described as an electro-ceramic (referred to as EC in the remainder of this paper for convenience). The PEO process is generally considered environmentally friendly, and is a non line-of-sight method than can access complex component geometry surfaces. Coating thicknesses possible by the PEO method range from submicron to many tens of microns depending on the process conditions.26–50 Although limited, previous studies suggest that the Mg substrate alloy can significantly impact the formation and protectiveness of PEO coatings irrespective of the coating solution electrolytes, process conditions, and targeted coating chemistry of Mg-base oxides or fluorides.26,28,30,33,39,45,48
The goal of the present work was to systematically investigate the effect of the substrate Mg alloy on the chemistry, morphology, and corrosion resistance of state-of-the-art PEO EC coatings. As Mg alloys frequently require additional corrosion protection via a multi-layer coating scheme, EC-coated Mg alloys with and without a subsequent cathodic electro-coat epoxy-base overlayer (referred to as E-coat in the remainder of this paper for convenience) were studied.14,15,34 Successful E-coat deposition for Mg alloys requires a surface pre-treatment such as chemical conversion or PEO EC coatings to promote adherence of the E-coat. The E-coat process is an electrophoretic deposition and can yield coatings tens of microns thick. It involves immersion in a liquid bath with an electric current used to attract the epoxy constituents to the component surfaces to be coated, followed by oven curing. Such coatings may also contain additive ceramic particles, which can improve scratch and wear resistance.
Experimental
Materials
Two classes of Mg alloys were studied: (1) Mg-Al-Zn type alloys: wrought AZ31B-H24 sheet (referred to as AZ31B for convenience) and cast AZ91D; and (2) Zr and RE modified Mg alloys: wrought sheets of ZE10A (ZEK100 type alloy) and WE43 (no temper). These alloys were selected to survey the effects of relatively low and high levels of Al or Zr + RE additions, and hence varied levels of second phase content, on EC coating formation and subsequent corrosion protection behavior. The ZE10A is also of great recent interest due to improved formability characteristics in sheet form.51 As-received alloy compositions analyzed by inductively coupled plasma atomic emission spectroscopy (ICP-AES) are shown in Table I. Note that the samples used for ICP analysis were mechanically abraded to a 320 grit surface finish using SiC abrasive paper and tap water as a lubricant to remove all residual surface finish prior to bulk compositional analysis.52
Table I. Alloy chemical compositions as determined by ICP-AES. Other REs in WE43 include Dy, Er, Gd, and Sr, with their combined levels presented.
| Mg | Al | Zn | Zr | Mn | aNd | Fe | Cu | Ni | other | |
| AZ31B | 95.45 | 2.99 | 1.01 | 0.001 | 0.532 | - | 0.001 | 0.001 | 0.001 | |
| AZ91D | 90.71 | 8.58 | 0.49 | 0.0009 | 0.19 | - | 0.0046 | 0.0035 | 0.0006 | 0.006 Si |
| ZE10A | Bal. | - | 1.43 | 0.342 | 0.007 | < 0.5 | 0.008 | 0.001 | 0.001 | |
| WE43 | Bal. | - | 0.019 | 0.45 | 0.015 | <2.5 | 0.0014 | 0.0034 | - | 3.89 Y 0.652 other REs b0.14 Ca |
aThe exact levels of Nd in ZE10A and WE43 are considered proprietary by the alloy manufacturer. bThe Ca detected in WE43 is present as an impurity, not as an intentional alloying addition.
The wrought sheets of AZ31B (∼1.6 mm thick), ZE10A (∼1.5 mm thick), and WE43 (∼1 mm thick) were provided by Magnesium Elektron North America, now Luxfer Graphic Arts, Madison, IL USA. The cast AZ91D (∼1.6 mm thick) was procured from CanmetMATERIALS, Hamilton, ON Canada. Test samples were electro-discharged machine (EDM) cut to nominal 25 × 25 mm squares and 15 mm diameter disks.
Coatings were applied by Henkel Corporation, Madison Heights MI, USA. The PEO EC coating was Henkel Bonderite MgC (magnesium coating). The top and bottom test sample faces began with the as-mill/as-cast surface conditions. Standard Mg cleaning and process conditions were used for all four alloys and involved: alkaline cleaning at 60°C for 1 minute, acid etching at 26°C for 1 minute, light acid desmutting for 1 minute at room temperature, and the MgC EC process for 1 minute. Deionized (DI) water rinse was performed after each stage and at the end of the MgC EC coating process. Additional EC coated samples were further treated by Henkel Corporation using Axalta Coating Systems (Philadelphia, PA USA) AquaEC4027 E-coat (gray). The as-MgC EC coated samples were rinsed in DI water for 30 seconds, E-coated for 2 minutes 20 seconds using 140 V, rinsed in DI water for 45 seconds, and cured at 182°C for 30 minutes.
Corrosion evaluation
Corrosion was assessed by H2 gas evolution measurements during immersion in 0.1 M NaCl (aq) at ambient temperature. The 25 mm × 25 mm square samples of the four alloys were tested in triplicate for each surface condition: (i) bare (uncoated), (ii) EC coat only and (iii) EC + E-coat. (Additional 15mm disk samples were also evaluated for select conditions). The comparison bare alloy samples were ground to a 4000 grit surface finish using SiC abrasive papers with ethylene glycol as a lubricant. They were then rinsed in ethanol and dried using absorbent wipes. The EC and EC + E-coated samples were rinsed in ethanol and dried using absorbent wipes as-coated (no mechanical abrasion of the coated samples). The edges of all samples were masked with lacquer to eliminate any edge effect as the coating quality on the edges and corners was found to be inconsistent under light optical microscopy (LOM) examination.
The samples were positioned upright in a 2 L beaker containing 1.5 mL of 0.1 M NaCl (aq), one sample per beaker. The solution was open to air for the duration of the experiment. An inverted funnel was placed over the sample and a burette filled with 0.1 M NaCl (aq) was placed over the tip of the inverted funnel. This apparatus collected the H2 gas evolved during corrosion, and thus allowed the H2 gas evolution rate to be monitored. Test duration was ∼7 days. After exposure, the samples were removed from the solution, rinsed with DI water then ethanol, dried using a stream of air, and photographed.
The EC + E-coated alloy samples were highly corrosion resistant in 0.1 M NaCl (aq), with borderline measurable quantities of H2 evolution registered. To initiate corrosion on these samples and assess their corrosion resistance after damage, a mechanical scribe (line defect) was made on one of the faces by hand with a tool matching the description in section 5.1.1 in ASTM D1654-08 (Standard Test Method for Evaluation of Painted or Coated Specimens Subjected to Corrosive Environments, ASTM International, West Conshohocken, PA, USA 2016). Microscopic imaging and testing by electrical continuity with a digital multimeter between the two ends of the scribes were used to confirm the scribe was through to bare metal. The surface area of the scribes was measured using LOM to allow normalization of the localized H2 gas evolution. Scribing was performed on EC + E-coated test samples that were initially exposed for 7 days, with an additional 8 days after scribing in 0.1 M NaCl (aq) for 8 days (15 days total).
The corrosion rate was calculated using the H2 evolution measurements in the following manner. The total volume of H2 evolved after the exposure was converted to moles of H2 evolved. We assumed that 1 mole of Mg was oxidized for every mole of H2 gas evolved (100% efficiency) according to the general corrosion reaction: Mg (s) + 2H20 (l) = Mg(OH)2 (aq) + H2 (g). The moles of Mg oxidized were converted to a mass of Mg oxidized, which in turn was adjusted by dividing by the nominal composition of Mg in the alloy to capture the mass of the alloy oxidized. The corresponding corrosion rate (mg/cm2/day) was calculated by dividing the mass of the sample oxidized by the exposed surface area and the exposure time. For the scribed EC + E-coated samples, the surface area was taken as the area exposed by the scribe itself, which was determined using LOM.
Microstructural characterization
Selected as-EC coated sample surfaces were evaluated by three-dimensional (3D) microscopy, X-ray photoelectron microscopy (XPS), X-ray diffraction (XRD), and scanning electron microscopy (SEM) with energy dispersive X-ray analysis (EDS). Surface roughness measurements were acquired using a Keyence VR-3000 series (Keyence, Osaka, Japan) 3D measuring macroscope. The instrument height resolution is reported as 0.1 μm, height repeatability as 0.5 μm, and height accuracy as ±3 μm. The XPS analysis used a monochromated, micro-focusing, Al Kα X-ray source (1486.6 eV) with a ∼400 μm X-ray spot size for maximum signal and to obtain an average surface composition over the largest possible area. Depth profiling analyses were conducted with a EX06 argon ion gun operated at 2000 eV and rastered over a 2 mm x 4 mm area (details repeated from reference 53). XRD continuous θ-2θ scans were performed on a Panalytical X'pert diffractometer from nominally 5 to 90° 2θ using CuKα radiation (λ = 1.540598 Å). All scans used ¼° fixed slits, ½° anti-scatter slit, 0.04 soller slits coupled with a 10 mm mask (beam length). For the XRD phase identification procedure, a search match was conducted using the Jade 2010 software (Materials Data Inc., Livermore, CA USA) and the International Centre for Diffraction Data (ICDD, Newtown Square, PA USA) database. A Hitachi S4800 field emission (FE) SEM, operated at 15kV, was used for secondary electron (SE) and backscattered electron (BSE) imaging of surface and cross sectioned samples. This FE SEM was also equipped with an EDS solid state detector from EDAX, Inc. and X-ray dot maps were acquired with Genesis software.
Select EC and EC + E-coated sample cross sections pre- and post- corrosion exposure were prepared by standard metallographic techniques using non aqueous polishing media and evaluated by FE SEM and electron probe microanalysis (EPMA). Elemental X-ray maps were acquired using a JEOL JXA-8200X EPMA instrument equipped with five crystal-focusing spectrometers for wavelength dispersive X-ray spectroscopy (WDS). X-ray dot maps acquired with the JXA-8200X for this study utilized a 15 kV accelerating voltage and electron beam currents of 50–100 nA. The JXA-8200 is also equipped with an energy dispersive X-ray spectrometer (EDS) silicon drift detector (SDD) from Thermo Fisher Scientific controlled with Noran System Seven software that was used to acquire X-ray dot maps, which were analyzed using principle component analysis.
Focused ion beam (FIB) milling, performed with a Hitachi NB5000 FIB/SEM instrument, was used to image buried interfaces in selected cross section samples. Creating a FIB milled region to image in SE mode with the electron beam column began with deposition of a ∼500 nm thick W layer onto the cross-section surface using ion beam deposition (IBD). This W layer is used to reduce "curtaining" during the final FIB milling of the specimen. The milling of the region of interest was started at with a 40 kV, 3.36 nA beam. The beam current was then reduced to 0.52 nA and the sample was thinned to electron transparency. Select sample surfaces were also prepared for analysis using FIB lift-out techniques. Scanning transmission electron microscopy (STEM) high angle annular dark field (HAADF) and bright field (BF) micrographs were collected using a FEI Talos F200X, equipped with a symmetric A-TWIN objective lens integrated with the SuperX energy dispersive spectrometer system and operated at 200kV. The silicon drift detector (SDD) SuperX system give the Talos a solid angle of 0.9 srad, maximizing the collection efficiency during X-ray analysis and mapping. Cryogenic cooling was not used for the FIB milling or STEM analysis.
Results
Visual inspection of as-EC coated alloys indicated relatively uniform gray-white appearance on the AZ31B, AZ91D, and ZE10A (the ZE10A was more white than gray), with a qualitatively patchier, white appearance on the WE43. After E-coat application, a generally gray/brown appearance was observed for all four alloys, with qualitatively more unevenness observed on the WE43 than for the ZE10A, AZ31B, and AZ91D.
Microstructural characterization of the EC coatings
Three-dimensional microcopy surface roughness characterization and surface SEM images of the as-EC coated AZ31B, AZ91D, ZE10A, and WE43 substrates are shown in Table II and Fig. 1, respectively. The roughness measurements were comparable for EC coatings on AZ31B, AZ91D, and ZE10A, with Sq in the 1 to 2 μm range and Sz in the range of 20 μm. In contrast, the EC formed on the WE43 was much rougher, with a Sq of 10.5 μm and Sz of 77.7 μm. The surface SEM analysis (Fig. 1) indicated relatively rough EC features on all four alloys. Surface porosity was also evident in all the coatings, particularly for the EC on AZ31B which contained a high density of 1 μm size range pores (Fig. 1b). Isolated cracking was also observed, particularly for the EC on AZ91D (Fig. 1d) and WE43 (Fig. 1h).
Table II. 3D microscopy surface roughness measurements for as-EC coated substrate alloys obtained over a ∼5 mm × 5 mm surface area. AZ31B and AZ91D data from 15 mm diameter coated samples; ZE10A and WE43 data from 25 mm × 25 mm square coated samples. Sq (root mean square), Ssk (skewness), Sku (kurtosis), Sp (maximum peak height), Sv (maximum pit height), Sz (maximum height), Sa (arithmetical mean height) (International Organization for Standardization, ISO 25178).
| Sq | Sp | Sv | Sz | Sa | |||
| (μm) | Ssk | Sku | (μm) | (μm) | (μm) | (μm) | |
| AZ31B | 2.3 | 0.2 | 3.3 | 8.6 | 10.8 | 19.4 | 1.8 |
| AZ91D | 1.3 | 0.5 | 8.9 | 11.6 | 10.8 | 22.4 | 0.9 |
| ZE10A | 2.3 | 0.4 | 3.5 | 12.5 | 9.1 | 21.6 | 1.8 |
| WE43 | 10.5 | 0.5 | 3.7 | 45.5 | 32.2 | 77.7 | 8.1 |
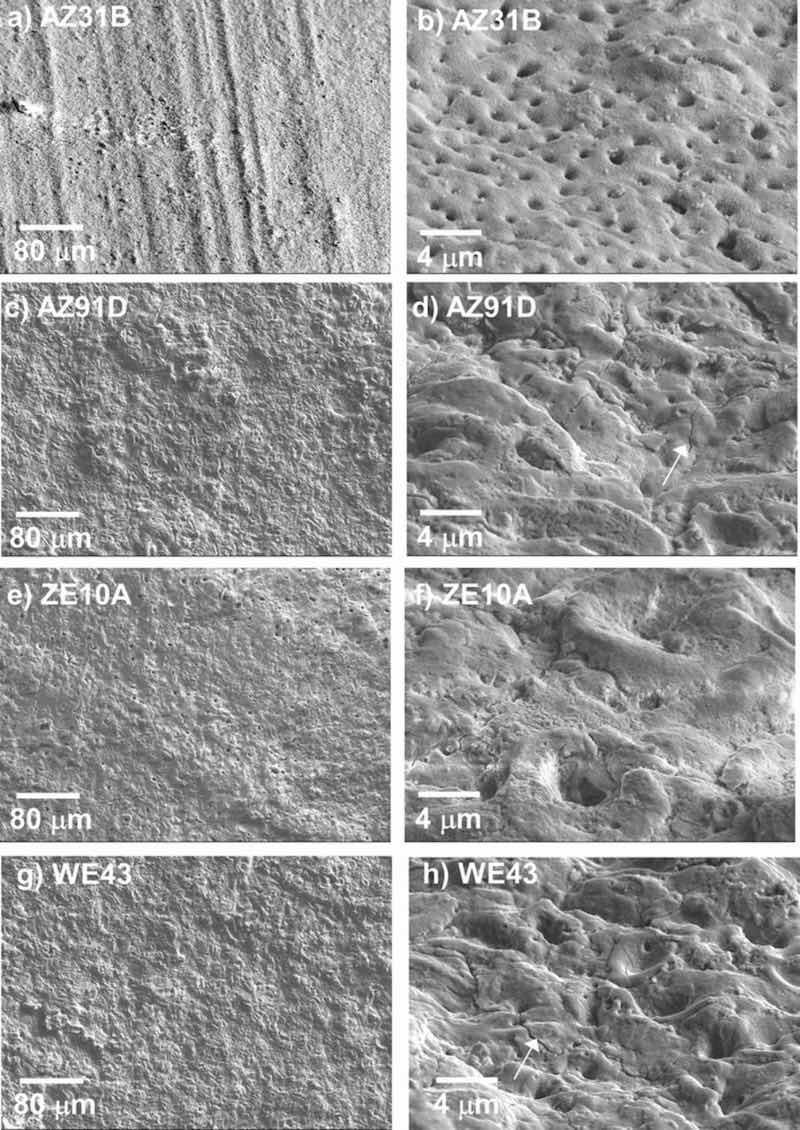
Figure 1. Surface SEM SE images of as-EC coated AZ31B, ZE10A, AZ91D, and WE43 alloys: a), c), e), f) top view; b), d), f), and h) tilted. Arrows mark cracks in the coating surface formed on AZ91D (d) and WE43 (h).
Scanning electron microscopy cross-section images of the as-EC coated alloys are shown in Fig. 2. Despite the use of the same EC coating process parameters, significant differences in EC morphology and thickness were observed between the different Mg alloy substrates. Thicknesses of the EC coatings were generally on the order of ∼2 μm for the AZ31B and ZE10A, ∼5 to 10 μm for the AZ91D, and up to ∼20–30 μm for the WE43, although local regions with thickness variability of an additional ∼5 to 10 μm were observed for all four alloy substrates, particularly for ZE10A and WE43. The coating morphologies formed on the AZ31B, ZE10A, and AZ91D were qualitatively similar and could be interpreted as consisting of an outer porous layer and a thin (<500 nm) continuous inner layer at the alloy-coating interface. In contrast, an outer porous layer also formed on the WE43, but the inner layer in many locations (although not all) was highly striated, consisting of multiple thin, continuous layers (Fig. 2d).
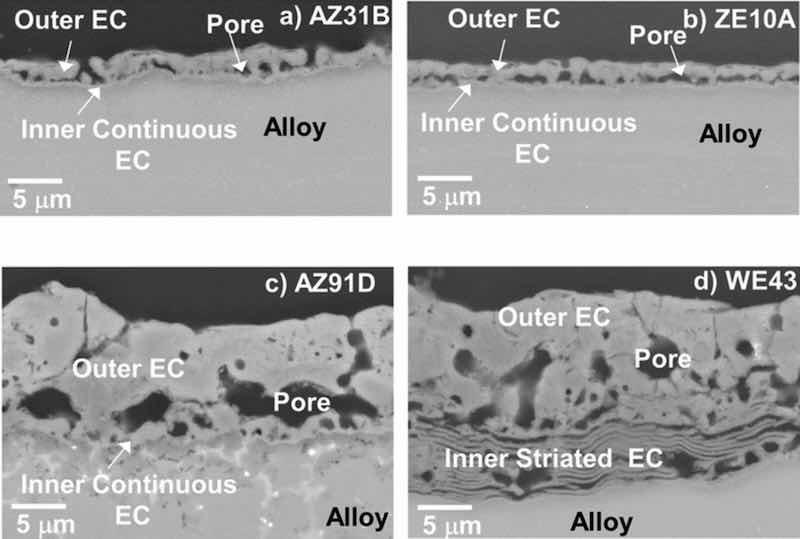
Figure 2. Cross-section SEM BSE images of as-EC coated AZ31B, ZE10A, AZ91D, and WE43 alloys showing coating porosity, thickness, and morphological differences.
X-ray photoelectron spectroscopy analysis of the near-surface region chemistry extending from the surface to ∼0.5 μm deep (12 nm/min sputter rate based on a SiO2 control) indicated that the outer regions of the EC coatings were similar on all four alloys, consisting primarily of Mg-F base compound(s) (Fig. 3). Oxygen was detected throughout the analyzed EC near-surface regions for all alloys in the range of ∼6 to 10 atomic percent (at.%). Residual alkali metal(s) (referred to collectively as AM for convenience) from the coating solution was also detected in the range of ∼8–10 at.% (specific identification of which AM(s) were present was considered proprietary by the coating manufacturer). For the AZ31B and AZ91D substrates, 1.5 to 2 at.% Al and 2.5–4 at.% Al, respectively were detected as well. For comparison, Al levels of 0.5 to 1.5 at% were measured in the EC formed on ZE10A and WE43, suggesting some incorporation of Al from the Mg-Al-Zn alloys AZ31B and AZ91D into the EC. All of the Al levels are shown in Figure 3e for comparison. No appreciable RE or Zr segregation to the near-surface regions of the EC formed on ZE10A or WE43 was evident. XRD analysis showed similar coating phase makeup on all four alloys, consistent with the XPS analysis. The EC contained a mixture of primitive cubic Pm-3m AMMgF3, a tetragonal P42/mnm MgF2, and a minor amount of MgO. In addition to Mg metal, Mg17Al12 from the underlying alloy substrates was also detected for the AZ91D and, in very minor amounts, AZ31B.
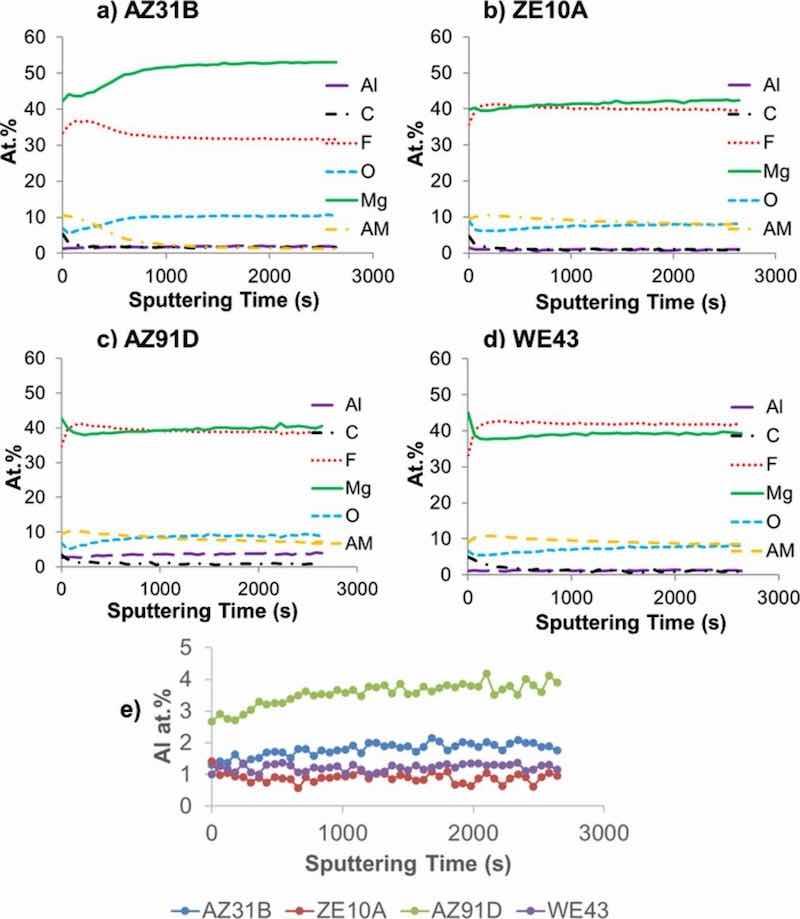
Figure 3. XPS sputter depth profile data for as-EC coated AZ31B, ZE10A, AZ91D, and WE43 alloys extending from the surface to ∼0.5 μm deep. The outer surface regions of the coatings formed on all alloys were Mg-F rich (AM = alkali metal). The calculated at.% compositions were obtained from the area under the spectrum curves using tabulated sensitivity factors.
Figures 4–7 show STEM cross-section images and corresponding elemental maps for the alloy-EC interface regions. Consistent with the XPS data, the STEM analysis indicated that the coatings were rich in Mg, F, and O. AM from the coating solution was also observed to decorate near surfaces of the F-rich regions. For AZ31B and AZ91D, Al from the alloy substrate was observed in the EC. Particularly in the case of AZ91D, local enrichment of Zn near the alloy-EC interface was also observed, although it was not clear if this Zn was associated with the second phase alloy microstructure and not a true enrichment. The maps also suggest possible incorporation of Zn and Mn into the EC layer, but the levels of these elements in the EC layer do not exceed that of the noise in the maps. For the ZE10A and WE43, the maps did not reveal any appreciable incorporation of Zr or REs into the EC, consistent with the XPS results.
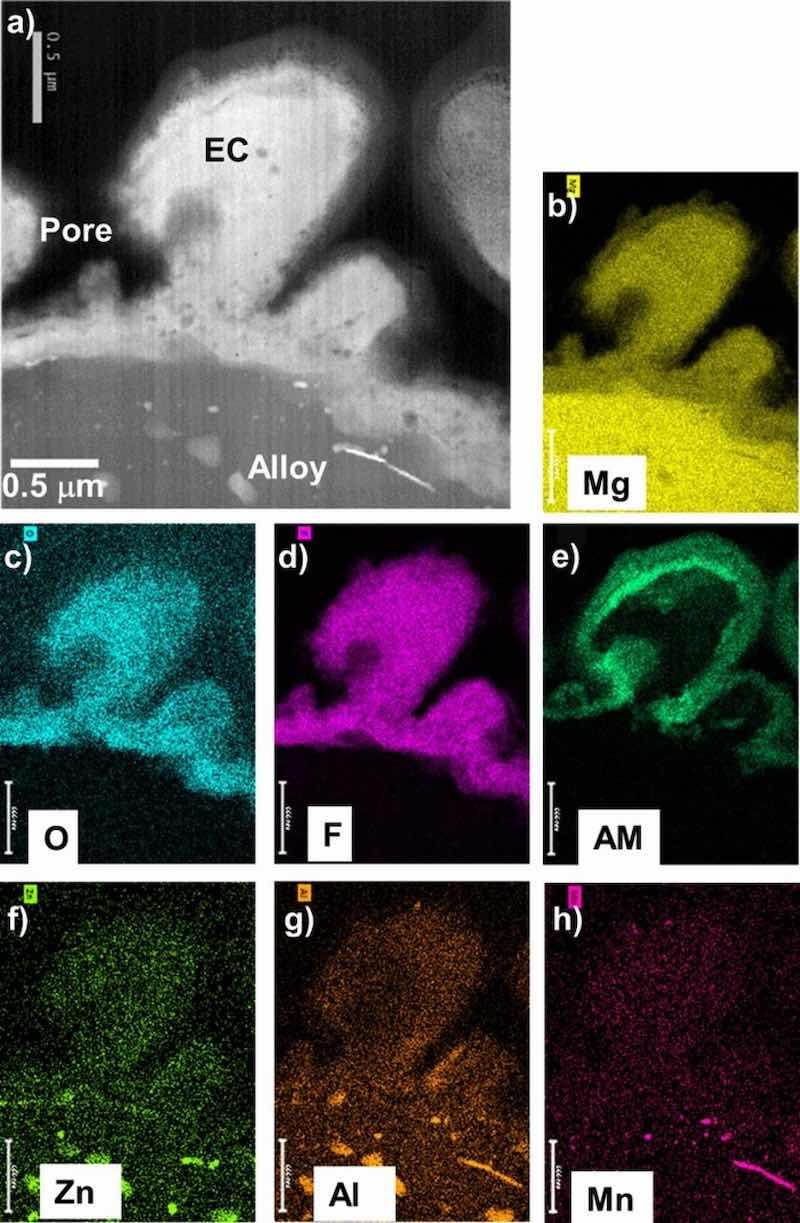
Figure 4. STEM Z-contrast cross-section image (a) and corresponding elemental maps (b-h) for as-EC coated AZ31B showing the coating is Mg-F-O rich, consistent with XRD and XPS data (AM = alkali metal). Second phase Al-, Zn-, Mn- rich particles are evident in the alloy immediately below the coating.
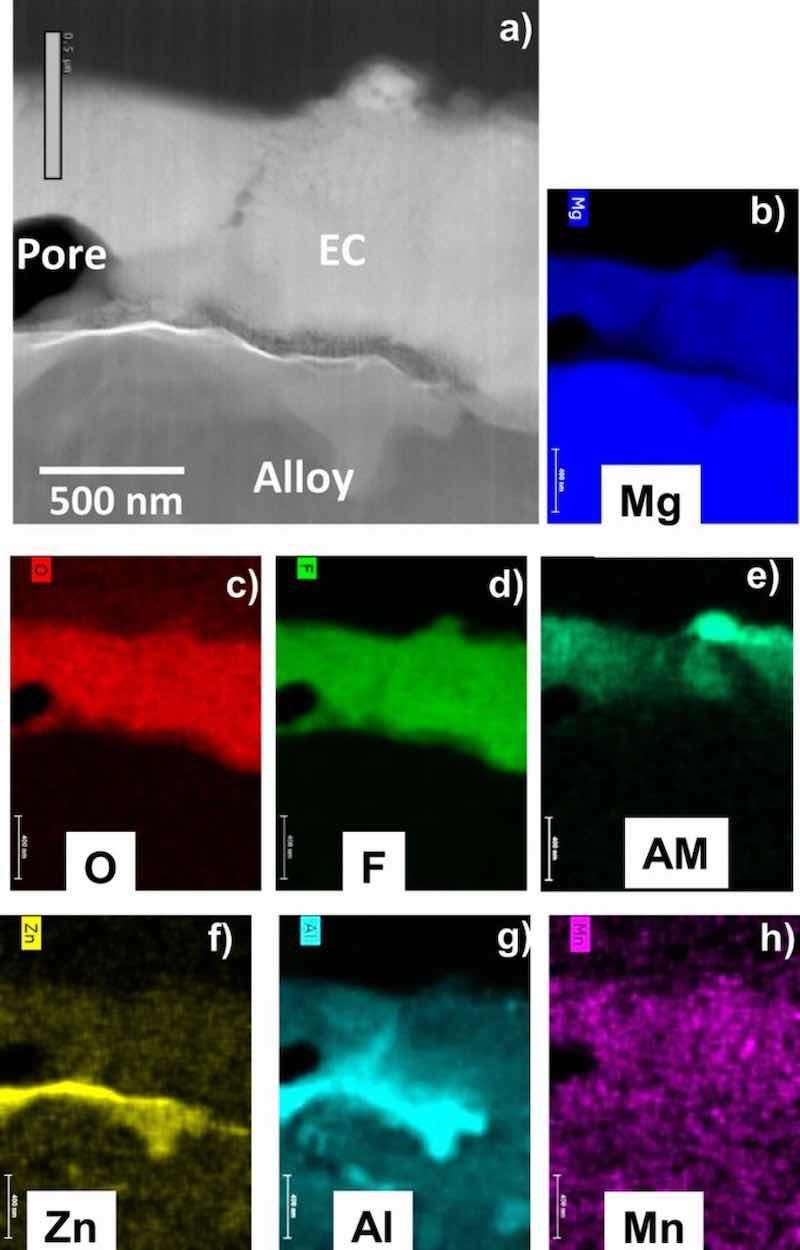
Figure 5. STEM Z-contrast cross-section image (a) and corresponding elemental maps (b-h) for as-EC coated AZ91D showing the coating is Mg-F-O rich, consistent with XRD and XPS data (AM = alkali metal). The Al-rich second phase near the alloy-EC interface is consistent with β Mg17Al12.
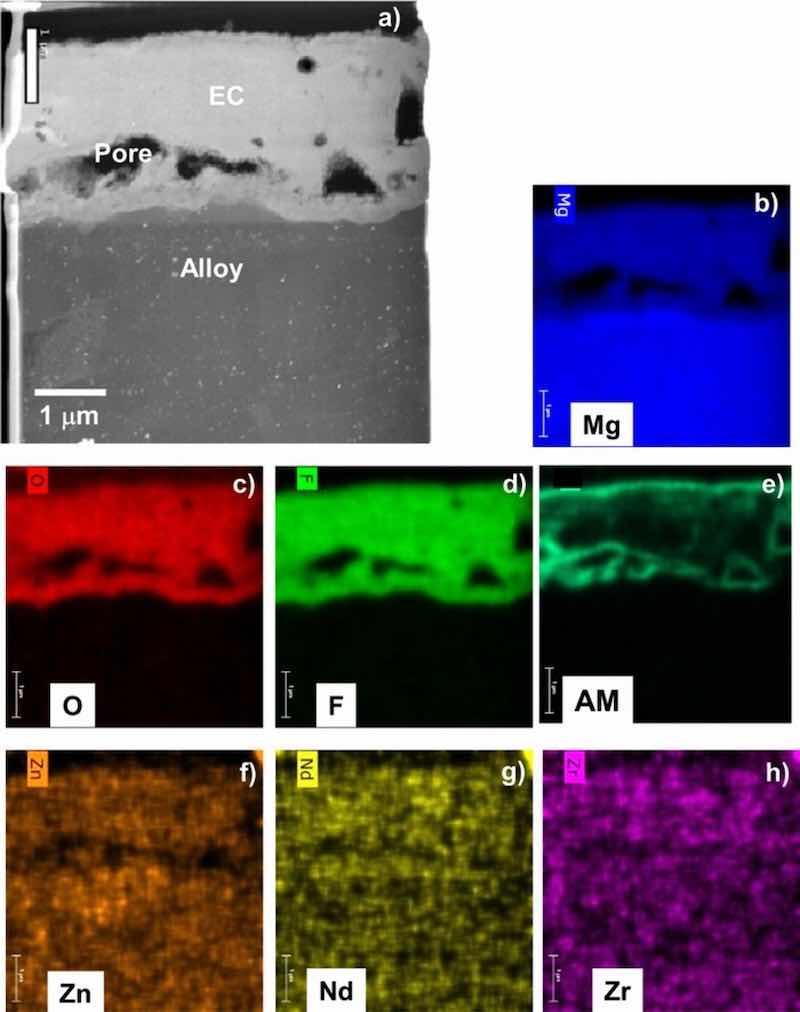
Figure 6. STEM Z-contrast cross-section image (a) and corresponding elemental maps (b-h) for as-EC coated ZE10A showing the coating is Mg-F-O rich, consistent with XRD and XPS data (AM = alkali metal). Fine, bright contrast second phase particles are evident throughout the alloy.
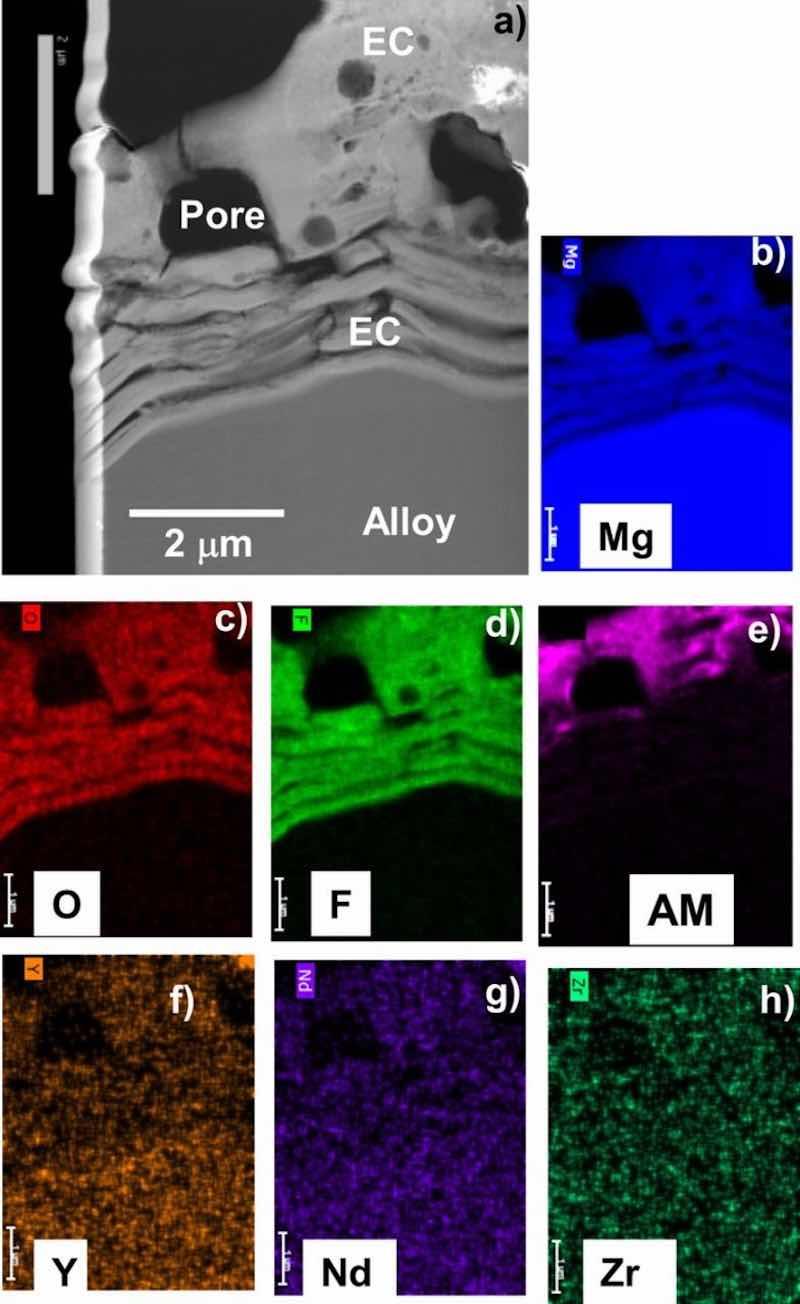
Figure 7. STEM Z-contrast cross-section image (a) and corresponding elemental maps (b-h) for as-EC coated WE43 showing the coating is Mg-F-O rich, consistent with XRD and XPS data (AM = alkali metal). The EC at the alloy-EC interface is highly striated.
Second phase particles were generally not extensively incorporated into the EC layer in any of the four alloys (Figs. 4–7). Second phase alloy particles were frequently observed in the alloy substrates underneath the EC coating, consistent with the established metallurgy of these alloys.28,39,47,48,53–56 These included: Al-Mn and Al-Zn rich particles in AZ31B (EDS maps in Figs. 4f, 4g, 4h); a cast cellular structure of Al-rich second phase in AZ91D, β Mg17Al12 based on XRD and EDS maps (Figs. 2c, 5g, and 8c); fine, submicron Zn-Zr and Nd rich particles in ZE10A (white alloy particles in Fig. 6a); and RE/Zr-rich particles in WE43 (not present in location shown in Fig. 7, but evident as white particles in Fig. 8h).
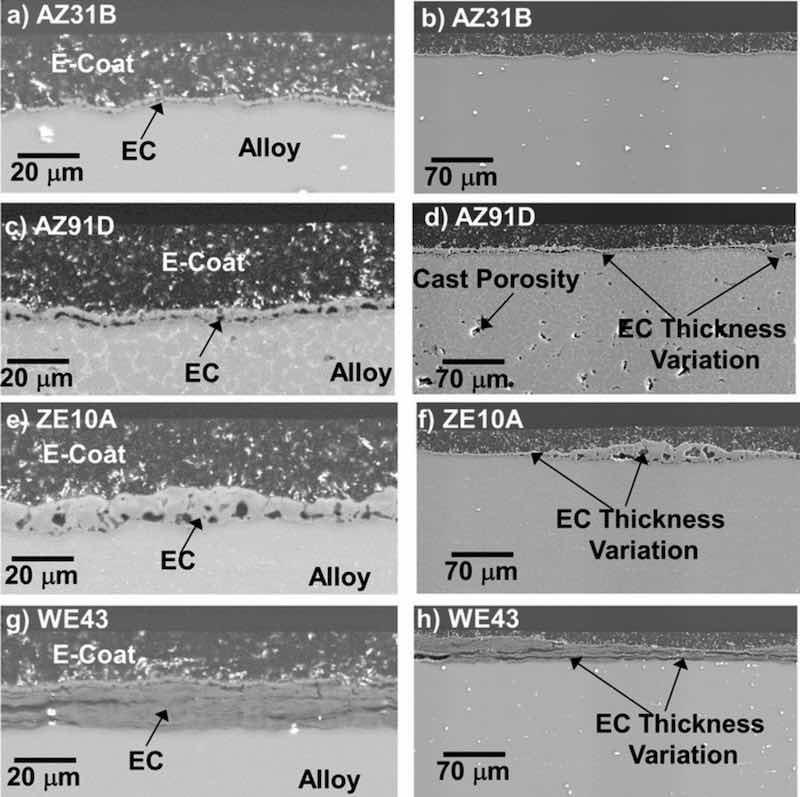
Figure 8. Cross-section SEM BSE images of EC + E-coat AZ31B, AZ91D, ZE10A, and WE43 alloys showing epoxy E-coat thickness on the order of 20–50 μm. Thickness variation is evident in the EC layers, particularly for ZE10A and WE43. Additive ceramic particles (bright contrast in the images) were present throughout the E-coat layer.
Microstructural characterization of the EC coatings with E-coat overlayers
Scanning electron microscopy cross-section analysis (Figs. 8a, 8c, 8e, 8g) indicated that the EC remained fully intact underneath the epoxy-base E-coat overlayer for all four alloys, with similar morphology to that observed for as-EC coated alloys (Fig. 3). Additive ceramic particles were also observed throughout the E-coat. Lower magnification images of the EC + E-coated alloys (Figs. 8b, 8d, 8f, 8h) show local thickness variation in the initial EC layer, which was particularly evident for AZ91D, ZE10A and WE43 in the regions shown in Fig. 8. Further, for the WE43 shown in Fig. 8g, the relative proportion of striated layers to the outer porous region was higher than that shown in Fig. 2d for as-EC WE43, again indicative of the variability of the coating formation on this alloy.
Figure 9 shows STEM cross-section images of the alloy-EC and EC-E-coat interface regions for all four alloys. The E-coats (epoxy and additive ceramic particles) were found to thoroughly percolate into the inner regions of the porous EC structures for all four Mg alloys studied, even the striated local EC structure formed on WE43. The EC formed on ZE10A qualitatively appeared to be less porous in some locations (Figs. 6 and 9c), which resulted in less local E-coat penetration. The chemistry of the inner EC layer was also preserved after E-coating for all four alloys. For example, Fig. 10 shows elemental maps of the alloy-EC and EC-E-coat interfaces formed on AZ91D. The EC regions remained Mg-F-O rich (AM also detected, maps not shown), with Al incorporation from the alloy substrate into the EC layer, as was observed with the as EC coated Mg-Al-Zn alloys AZ91D and AZ31B (Figs. 3–5). Carbon maps were used as an additional assessment approach to confirm epoxy E-coat penetration of the porous regions within the EC. Similar retention of the Mg-F-O-AM EC chemistry and penetration of the EC by the E-coat, as supported by C maps, was observed in the EC + E-coating formed on WE43, again despite the complex inner striated EC structure formed on this alloy (Fig. 11).
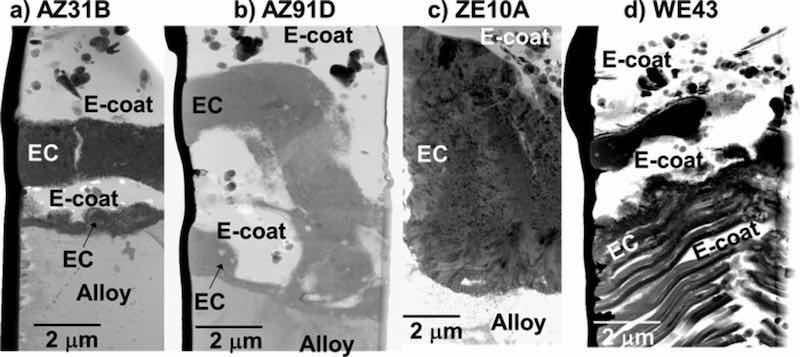
Figure 9. Cross-section STEM BF images of EC + E-coated AZ31B, AZ91D, ZE10A, and WE43 alloys showing penetration of the E-coat throughout the porous EC layer structures.
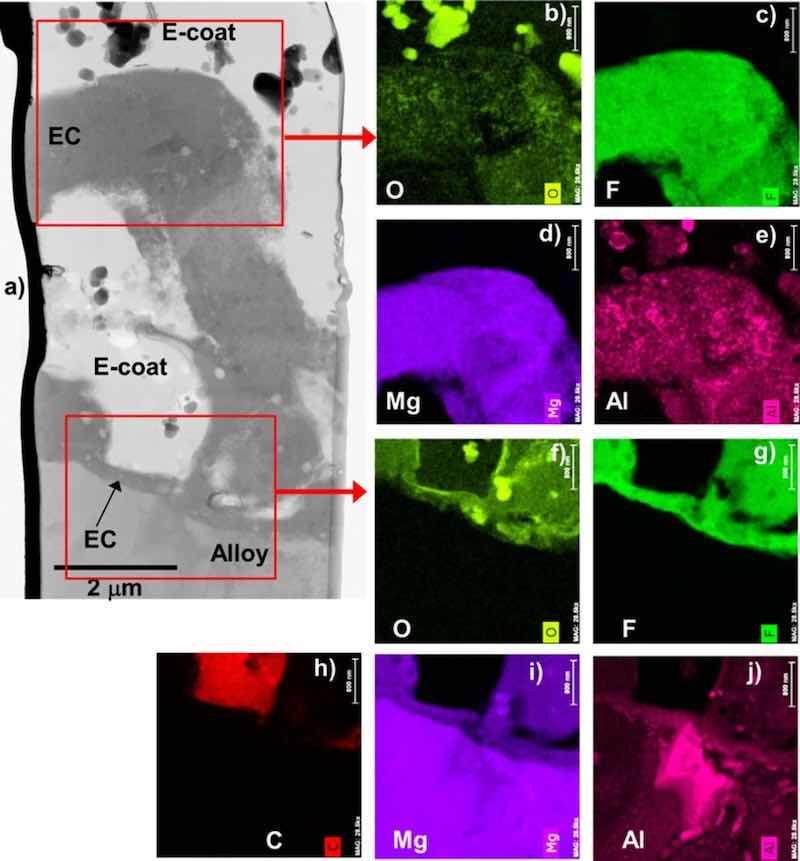
Figure 10. STEM BF cross-section image (a) and corresponding elemental maps (b-j) for EC + E-coated AZ91D. Aluminum from the AZ91D substrate was present throughout the EC structure. Deposition of E-coat did not impact the Mg-F-O rich EC chemistry.
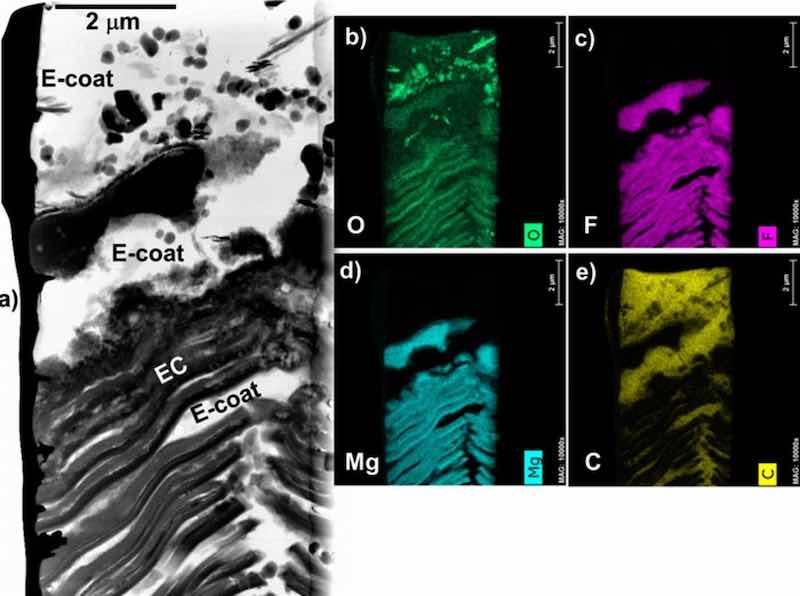
Figure 11. STEM BF cross-section image (a) and corresponding elemental maps (b-e) for EC + E-coated WE43. Deposition of E-coat did not impact the Mg-F-O rich EC chemistry.
Corrosion evaluation of bare and coated alloys
Figure 12a shows the average corrosion rates calculated from H2 evolution measurements normalized over exposed surface area after ∼7 days (168 h) in 0.1 M NaCl (aq) for bare alloy, EC coated, and EC + E-coated (duplicate or triplicate samples run for all). The EC coated alloys followed the trends observed for the bare alloys, qualitatively in the order from most to least corrosion resistant of AZ91D ≈ WE43 > ZE10A ≈ AZ31B. The EC coated corrosion data showed considerable scatter (see error bars in Fig. 12a), which is not unexpected as the EC treatment is not designed to provide corrosion resistance under aggressive NaCl solution immersion conditions on its own, but rather intended to enhance overlayer bonding via a porous outer structure (as shown in Figs. 2, 4–7, 9) and contribute to the overall corrosion resistance of multi-layer coating systems.
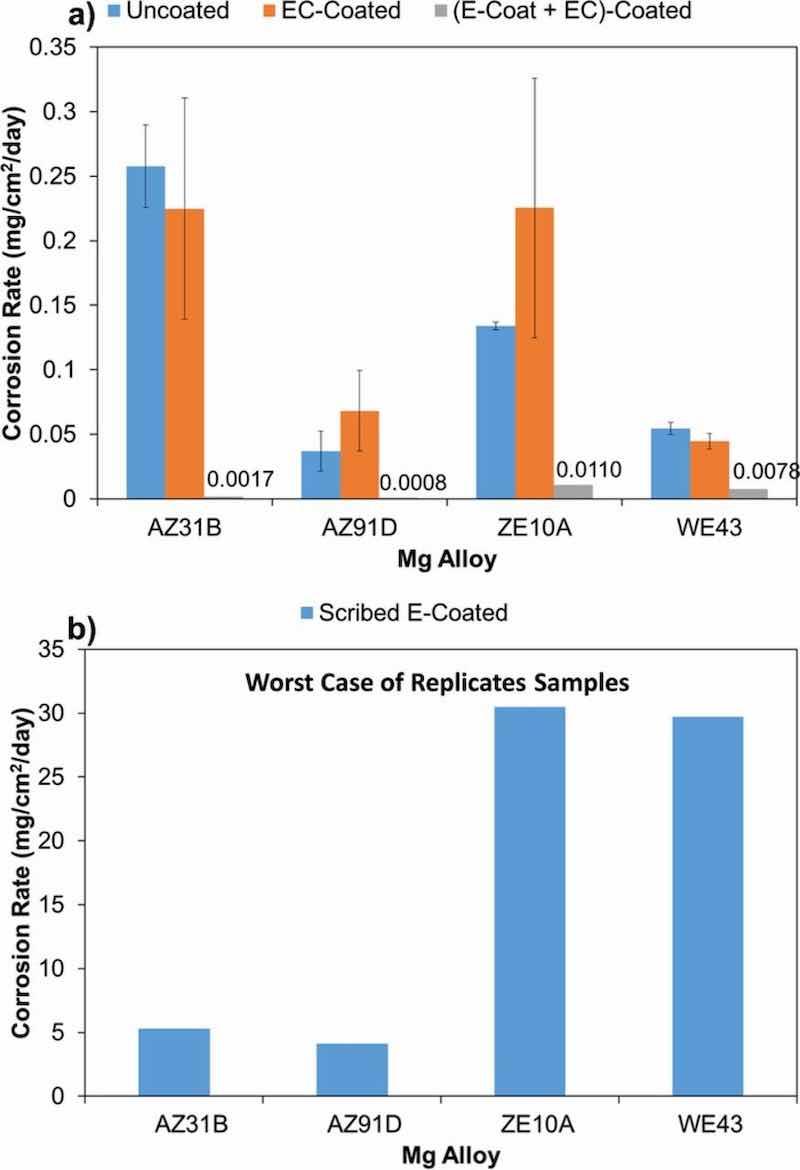
Figure 12. Corrosion rates calculated from H2 evolution measurements for bare and coated AZ31B, AZ91D, ZE10A, and WE43 alloys. (a) 7 days immersion in 0.1M NaCl (aq) for uncoated, EC, and EC + E-coated alloys; (b) additional 8 days immersion of EC + E-coated alloys after scribing (data normalized over scribed area).
The addition of the E-coat overlayer resulted in excellent corrosion resistance for all four alloys (Fig. 12a), with H2 evolution near the measurable detection limit for many of the EC + E-coated samples. The calculated average corrosion rates for the AZ31B and AZ91D were on the order of ∼0.001 mg/cm2/day, too low to be readily visible on the scale of the plot showing bare and EC coated alloys (Fig. 12a). Moderately higher calculated average corrosion rates on the order of ∼0.01 mg/cm2/day were registered for the EC + E-coated ZE10A and WE43, still consistent with good corrosion protection. The higher calculated average corrosion rates for EC + E-coated ZE10A and WE43 were due to higher sample to sample variation, with one of the three runs exhibiting higher levels of H2 evolution (further details presented in Table III).
Table III. Comparative data for H2 gas evolved (ml) after 7 days (∼170 h, ranged from 164 to 173 h) in 0.1 M NaCl(aq). This data is not normalized to exposed surface area (all samples have similar nominal ∼25mm × 25mm dimensions). The scribed EC + E-coated samples are the same samples that were initially immersed for 170 h without scribing (data provided for ∼340 h total exposure, ∼170 h after scribing).
| Alloy/ Run# | Bare allo | EC | EC+E-coat | Scribed EC+ |
| AZ91D-1 | 1.6 | 5.4 | 0.1 | 0 |
| AZ91D-2 | 3.3 | 8.0 | 0.1 | 0 |
| AZ91D-3 | 4.0 | 3.0 | 0.1 | 1 |
| ZE10A-1 | 11.8 | 9.6 | 0.1 | 0.6 |
| ZE10A-2 | 11.4 | 25.4 | 0 | 1.1 |
| ZE10A-3 | C21.4 | B16.5 | 2.8 | 12.5 |
| AZ31B-1 | 18.9 | A23.4 | 0.2 | 0.2 |
| AZ31B-2 | 22.6 | 15.9 | 0.2 | 0.1 |
| AZ31B-3 | 24.2 | 14.2 | 0.1 | 3.0 |
| WE43-1 | 4.4 | 4.0 | 0.3 | 0.4 |
| WE43-2 | 5.2 | 3.4 | 1.2 | 18 |
| WE43-3 | 4.4 | - | 0.4 | 0.1 |
A: After 140 h immersion. B: After 114 h immersion. C: After 95 h immersion.
To further evaluate the corrosion resistance of the EC + E-coated alloys, the triplicate samples exposed for ∼7 days in 0.1 M NaCl (aq) were scribed down to the bare alloy, and then immersed for an additional ∼8 days in the 0.1 M NaCl (aq). The scribing resulted in run-to-run scatter among the test samples, particularly for the EC + E-coated ZE10A and WE43, which exhibited worse corrosion resistance than the EC + E-coated AZ31B and AZ91D due to one very poor performing sample in each of the triplicates run. Figure 12b shows the calculated corrosion rates for the worst performing of the scribed triplicate samples run for each alloy. Calculated corrosion rates on the order of 5 mg/cm2/day were observed for the worst performing scribed EC + E-coated AZ31B and AZ91D, whereas the worst performing scribed EC + E-coated ZE10A and WE43 exhibited rates 6 times higher, on the order of 30 mg/cm2/day. One caution in this calculation is that the data were normalized for the measured scribe surface area, not the entire test sample. However, as will be seen particularly for the scribed EC + E-coated WE43 substrate, corrosion attack spread well beyond the scribed region. This resulted in artificially high calculated corrosion rates due to normalization by a smaller scribed surface area than the area that was actually corroding for several of the samples. Therefore, Table III shows the raw (not area normalized) H2 gas evolution measurement results for all samples studied.
Microstructural characterization of scribed EC + E-coated alloys after corrosion
Surface SEM analysis of some additional replicate 15 mm diameter EC + E-coated samples exposed for 7 days in 0.1 M NaCl (aq), scribed, and exposed for an additional 7 days are shown in Fig. 13 (data from Fig. 12 and Table III were obtained from 25 mm × 25 mm square samples). Although corrosion attack was observed in the scribed regions for this set of AZ31B, AZ91D, and ZE10A sample surfaces, the visible surface attack did not spread appreciably beyond the lateral surface confines of the scribed region. In contrast, for EC + E-coated WE43, blistering was observed beyond the lateral confines of the scribed region, extending across the sample surface. Such surface blisters were also observed on the 25 mm × 25 mm square EC + E-coated WE43 sample from Fig. 12b.
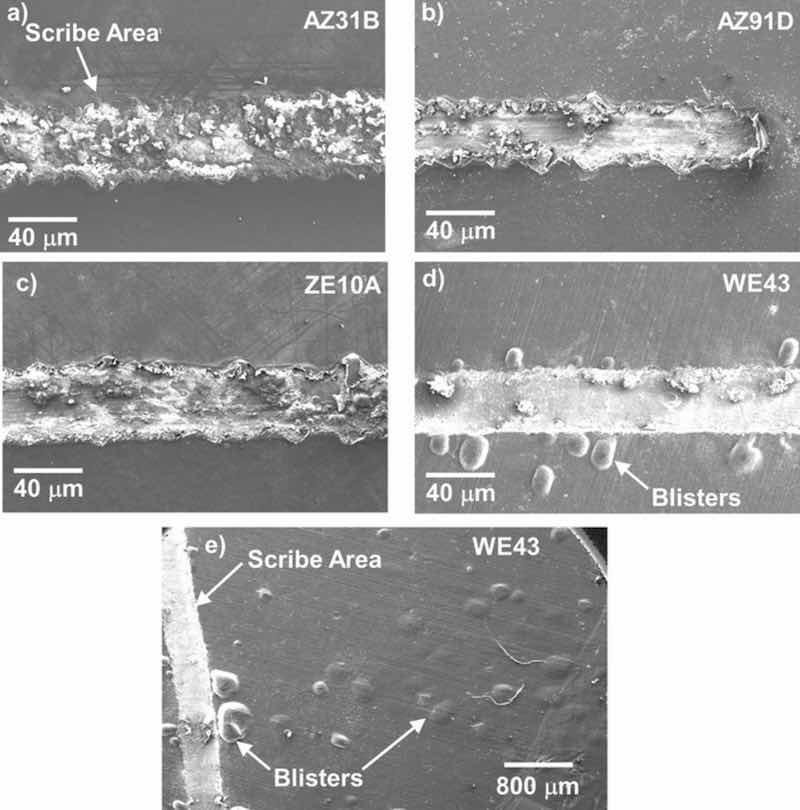
Figure 13. SE mode surface SEM images of scribed regions of EC + E-coated ∼15mm diameter alloy disks after 7 days exposure in 0.1M NaCl (aq) as-coated, scribing, and then 7 additional days exposure in 0.1M NaCl (aq). Extensive blistering was observed to extend from the scribed region across the sample surface for EC + E-coated WE43.
Figure 14 shows SEM surface images and STEM cross-section analysis of a FIB lift-out of the material directly underneath a blister formed adjacent to the scribe on the EC + E-coated WE43 after immersion in 0.1 M NaCl (aq) (same sample as Figs. 13d, 13e). FIB cutting and removal of the E-coat blister (Figs. 14a, 14b) showed the presence of corrosion underneath the blister. The lift-out cross-section of this corroded region (Figs. 14c–14h) revealed a local pocket of relatively intact Mg-F base EC layer entrapped in Mg-O rich corrosion product above and below (analysis to distinguish the relative portions of MgO and Mg(OH)2 in the corrosion product was not pursued).
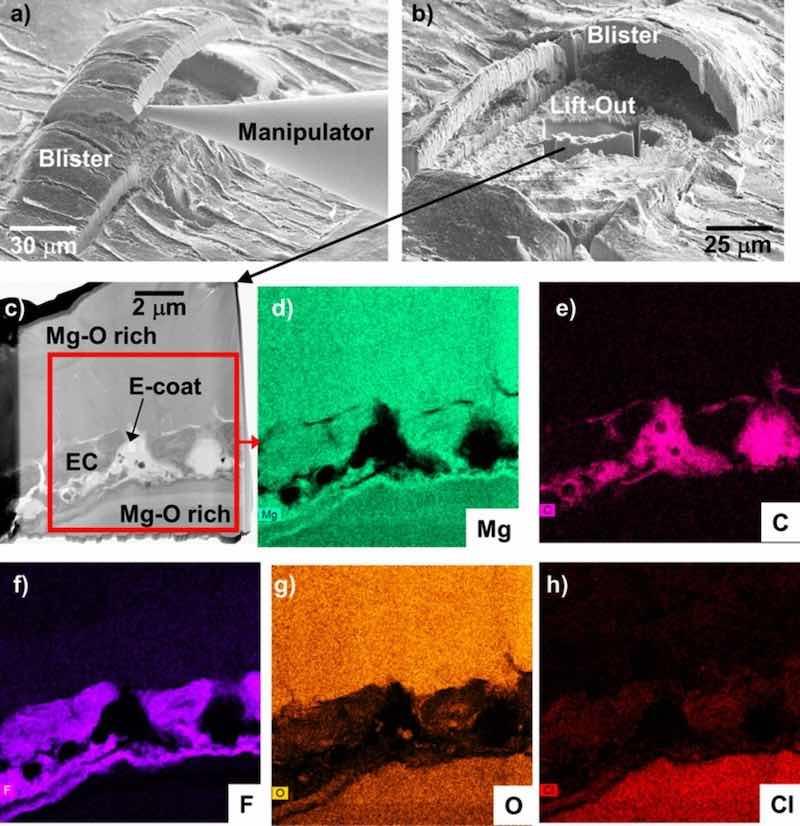
Figure 14. SE mode surface SEM images (a,b) of FIB lift-out of a blister formed on EC + E-coated WE43 after 14 days total exposure in 0.1M NaCl (aq) (7 days with a scribed surface) from Fig. 13. STEM analysis and corresponding elemental maps of the lift-out region in (b) are shown in (c-h).
Scanning electron microscopy cross-section images of the scribed and corroded EC + E-coated 25 mm × 25 mm alloy square samples from Fig. 12b are shown in Fig. 15 for all four alloys. As expected, corrosion at the bottom of the scribe-exposed alloy was observed. At the scribed region-coating interfaces, lateral corrosion attack into the EC + E-coat was also observed. Figs. 16–19 show STEM cross-section analysis of these regions. In the scribed EC + E-coated AZ31B (Fig. 16), lateral delamination of the E-coat on the order of 100 μm was observed. The separation occurred within the EC layer, with oxidized Mg-F from the EC layer found both above and below the separation. For the scribed EC + E-coated AZ91D (Fig. 17), a portion of the E-coat cracked off laterally, with the exposed inner EC layer retained, but corroded laterally from the scribed region interface. At the location analyzed (Fig. 17b), the alloy-EC and EC-E-coat interfaces remained relatively intact despite corrosion of the EC.
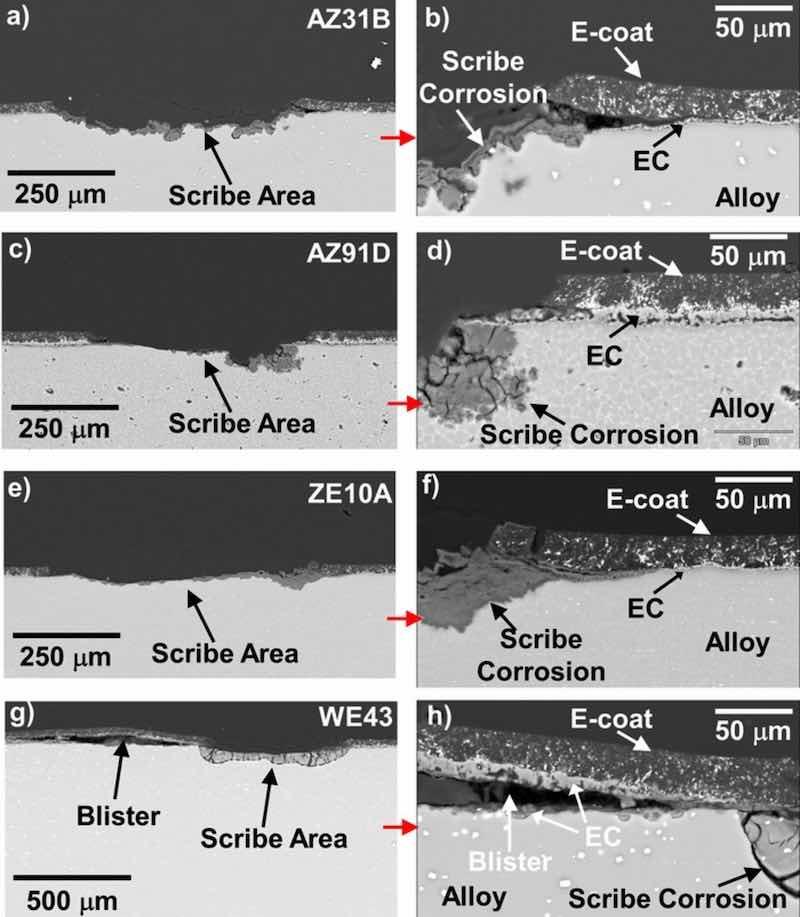
Figure 15. BSE mode cross-section SEM images (a-h) of the scribed regions of the EC + E-coated 25mm × 25mm AZ31B, AZ91D, ZE10A, and WE43 alloy square samples after 7 days exposure in 0.1M NaCl (aq) as-coated, scribing, and then 8 additional days exposure in 0.1M NaCl (aq). Varying degrees of attack were observed moving laterally from the scribe-coating interfaces, with more extensive coated region degradation observed for ZE10A and WE43.
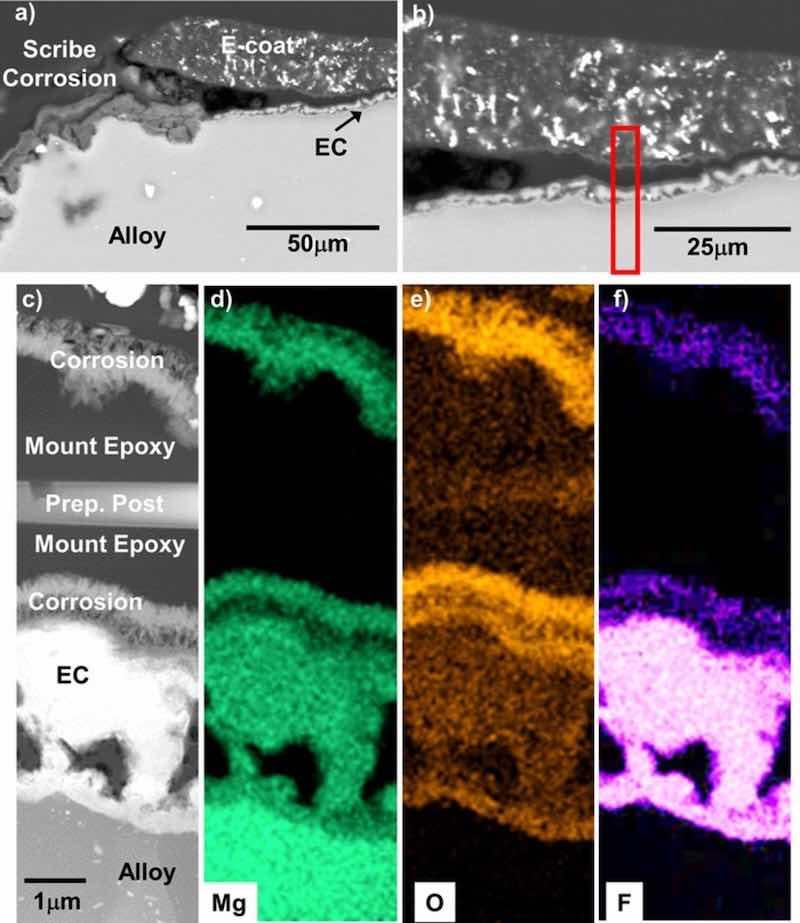
Figure 16. BSE mode cross-section SEM images (a-b) of the scribed regions of the EC + E-coated AZ31B after 15 days total exposure in 0.1M NaCl (aq) (8 days with a scribed surface) from Fig. 15. STEM analysis and corresponding elemental maps of the red box region in (b) are shown in (c-f). Lateral separation and corrosion occurred within the EC layer.
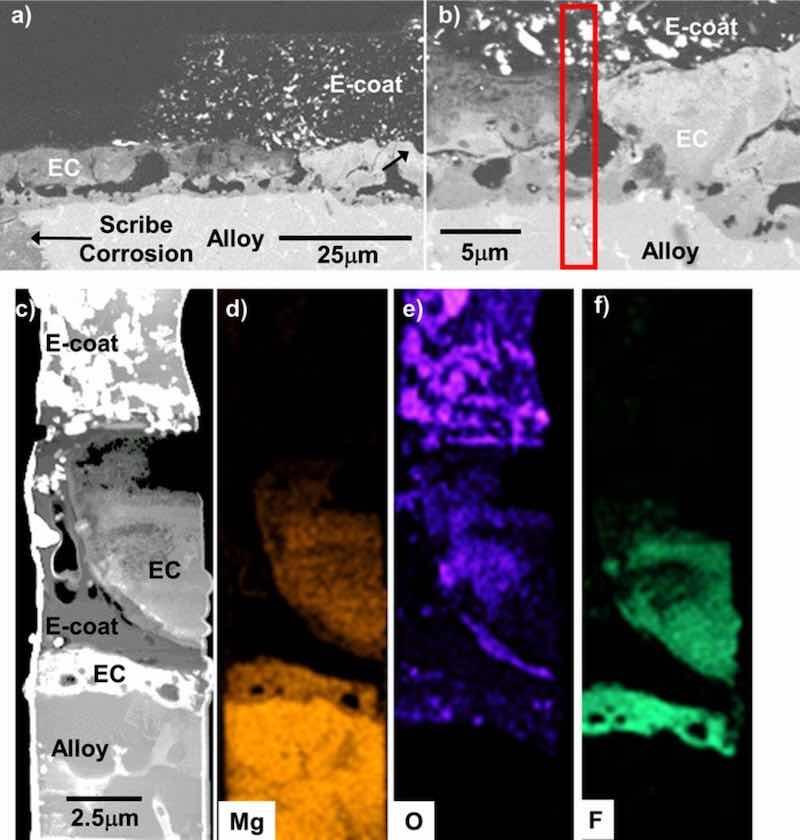
Figure 17. SE cross-section SEM images (a-b) of the scribed regions of the EC + E-coated AZ91D after 15 days total exposure in 0.1M NaCl (aq) (8 days with a scribed surface) from Fig. 15. STEM analysis and corresponding elemental maps of the red box region in (b) are shown in (c-f). The EC layer was laterally corroded but remained intact and adherent to the alloy.
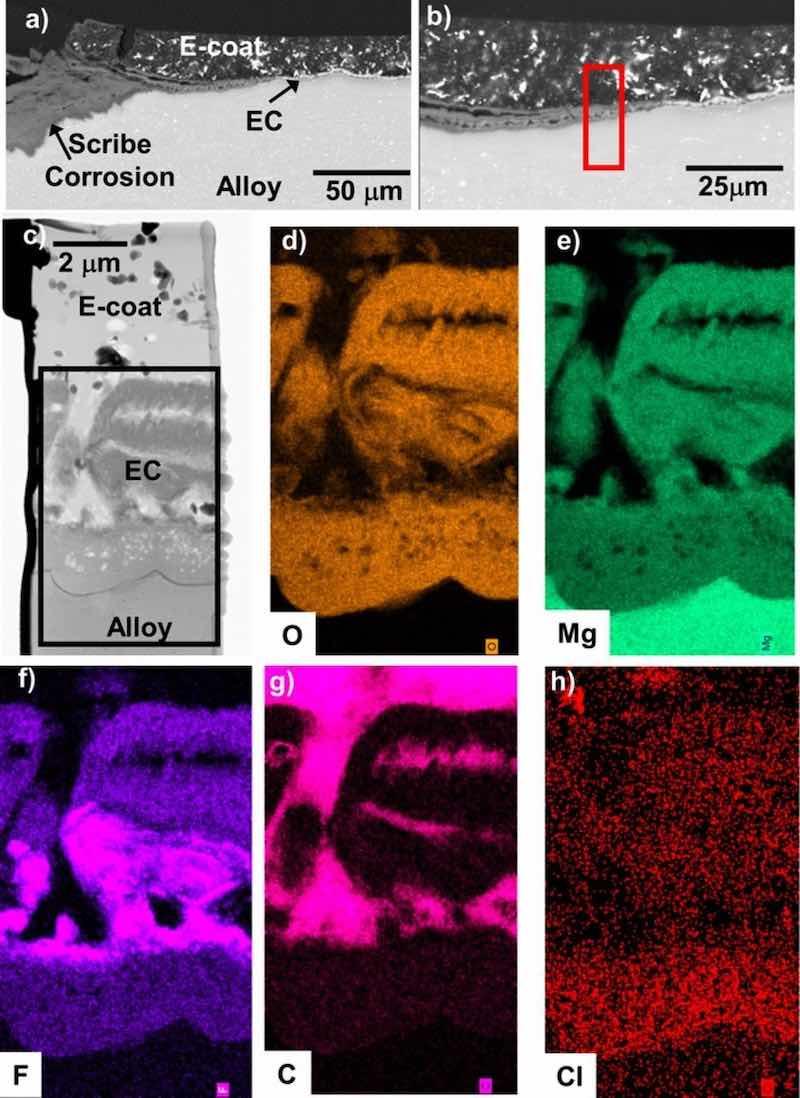
Figure 18. BSE mode cross-section SEM images (a-b) of the scribed regions of the EC + E-coated ZE10A after 15 days total exposure in 0.1M NaCl (aq) (8 days with a scribed surface) from Fig. 15. STEM analysis and corresponding elemental maps of the red box region in (b) are shown in (c-h). Both the EC layer and the underlying alloy were corroded well away from the scribed region interface.
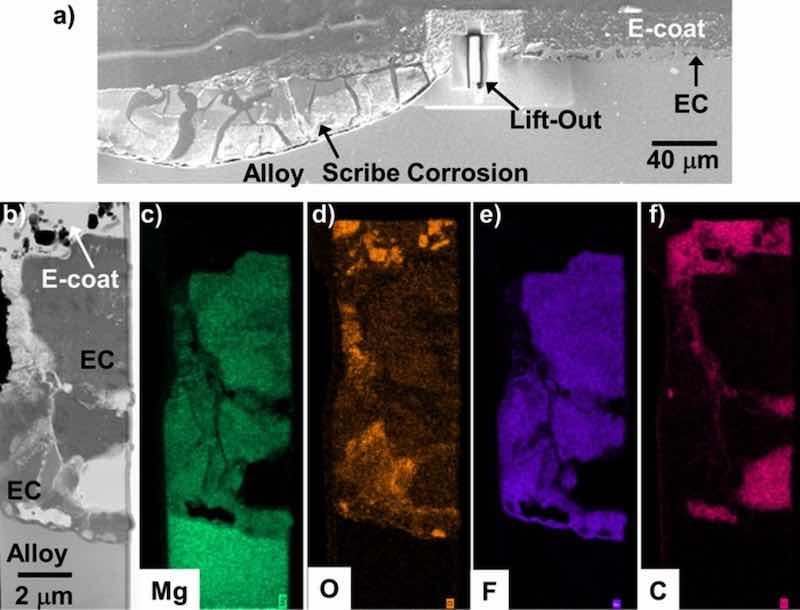
Figure 19. BSE mode cross-section SEM image (a) of the scribed regions of the EC + E-coated WE43 after 15 days total exposure in 0.1M NaCl (aq) (8 days with a scribed surface) from Fig. 15. STEM analysis and corresponding elemental maps of the lift-out region in (a) are shown in (b-f). The location imaged did not contain the highly striated EC morphology, and did not suffer from blistering or extensive attack.
Extensive corrosion at the scribed-coated region interface was observed in the scribed EC + E-coated ZE10A (Fig. 18). The corrosion proceeded laterally, undercutting the alloy-EC interface. Both F and Cl were detected in the attacked region adjacent to the underlying alloy at a location near the lateral transition to intact coating (Figs. 18b, 18f, 18h). (Trace levels of Cl were occasionally detected in elemental maps for the other scribed EC + E-coated alloys as well). A location of relatively intact coating (no blister per Figs. 13d, 13e and 14) was analyzed for the EC + E-coated WE43 (Fig. 19). This location did not exhibit the striated inner EC morphology typically seen for the WE43 (Figs. 2d, 7, 8g, 8h, 9d). The alloy-EC and EC-E-coat interfaces were relatively intact with comparatively little lateral corrosion penetration at this location, in contrast to the blister location shown in Figs. 14 and 15b.
Discussion
Similar Mg-F base EC coating chemistry with minor amounts of AM and O (Figs. 3–7) formed on all four alloy substrates. With the exception of a minor amount of Al (≤ ∼4 at.% based on XPS sputter depth profiling) in the EC layer formed on AZ31B and AZ91D, appreciable uptake of alloying additions from the Mg alloy substrates to the EC coating was generally not observed (Fig. 3e shows higher Al levels in the EC layers formed on AZ31B and AZ91D than ZE10A and WE43). Extensive entrapment of second phase particles from the underlying alloy into the EC layer was also generally not observed. Taken together, these findings suggest a primarily outward-dominated growth mechanism for the EC layer formed on these alloys. These findings are in partial contrast to the available literature, which generally suggests a mixed inward and outward growth mechanism for PEO coatings on Mg alloys, although the data is primarily from oxide coatings rather than the fluoride-base coatings studied in the present work.26,31,35 Further, there are multiple reports of the incorporation of alloying additions and second phase particles in PEO coatings26,27,31,35,38,45 in contrast to the results presented here.
Although the Mg alloy substrate did not have a strong impact on the chemistry of the EC layer, significant variation in EC coating thickness and morphology was observed on the alloys when using the same coating process parameters (e.g. Fig. 2). The EC layer formed on AZ31B, ZE10A, and AZ91D could be interpreted as duplex, with a thin, continuous inner layer and a thicker porous outer layer. However, the outer porous layer was considerably thicker on the 8.6 wt% Al AZ91D than the 3 wt% Al AZ31B (Table I), consistent with reports by references26,30,33,38,39,45,48 which found differences between alloy matrix and second phase PEO interactions and growth rates, with higher Al or second phase content resulting in thicker coatings. A similar trend was observed for ZE10A vs WE43, with the higher levels of RE and Zr in the WE43 (Table I) resulting in thicker and rougher coatings, consistent with reports by references.26,33,38,39,45 In contrast to previous reports primarily for oxide PEO coating formation,26–50 a different inner layer morphology comprised of a series of thin striated layers (Figs. 2,7) was formed on the WE43 with fluoride PEO EC coating. The mechanistic reasons for this striated structure were not specifically studied; but may be related to locally accelerated EC formation by the high RE content in WE43. As will be discussed later, the striated structure formed on the WE43 was implicated in susceptibility to delamination in scribed EC + E-coated WE43. In contrast, although lateral attack of the EC layer at the scribed material interface occurred within the EC + E-coated AZ31B and AZ91D, it did not propagate an appreciable distance or under-cut the coating.
The corrosion resistance of as-EC coated alloys exhibited substantial scatter, attributed primarily to their porous nature (Fig. 2), and generally followed the corrosion resistance trends of the bare alloys, with no evident improvement in corrosion resistance for 7 day immersion in 0.1 M NaCl (aq) (Fig. 12). The order of corrosion resistance from greatest to least for bare and EC-coated was AZ91D ≈ WE43 > AZ31B ≈ ZE10A. Although F-rich Mg-F compounds can result in significant improvement in corrosion resistance of Mg alloys,13,46,57–59 the porous nature of the EC layer (Figs. 2, 4–7) did not provide sufficient protection over multi-day immersion in 0.1 M NaCl(aq), which is an aggressive condition for Mg alloys.
However, it should be stressed that the PEO EC and process conditions of the present work were not designed to be a standalone coating for Mg alloys, rather they were designed to be utilized as an initial surface treatment as part of a coating system with additional overlayer(s). In this scenario, although the EC porosity resulted in susceptibility to corrosion as EC-coated, the porosity also provided paths for extensive penetration of the E-coat. Such penetration is anticipated to be advantageous for overall coating adherence and protectiveness. Further, the initial EC coating structure was fully preserved after E-coat processing. This is in contrast to a recent study of conversion coatings that reported instances of degradation of the initial conversion coated surface as a result of subsequent E-coat processing, such that corrosion resistance of the coating system was degraded.52 As shown in Fig. 12a, the EC + E-coating of the present work resulted in excellent corrosion resistance over multi-day immersion in 0.1 M NaCl(aq) for all four alloys showing essentially equivalent corrosion resistance, despite their significant differences in corrosion resistance uncoated (bare) and as EC coated.
Scribing of the EC + E-coat to bare metal resulted in increased susceptibility of some replicate samples to corrosion. However, the corrosion-resistance trends of the worst performing replicate samples did not revert to the bare or EC-coated sample behavior trend of AZ91D ≈ WE43 > AZ31B ≈ ZE10A (most to least corrosion resistant), rather after scribing the order switched to AZ91D≈AZ31B > ZE10A ≈ WE43. STEM analysis (Figs. 13–19) revealed multiple susceptibility attack modes of the coating structure occurred after scribing. Of particular interest, for some of the EC + E-coated WE43 samples, blisters of attack propagated well beyond the scribed region (Figs. 13d, 13e). The blisters were lifted areas of the E-coat, with extensive corrosion underneath entrapping local regions of somewhat intact EC Fig. 14). It is hypothesized that scribing resulted in delamination within the striated EC structure formed on WE43, permitting corrosion attack to propagate widely outside of the scribed region. In a scribed interface location where the striated EC morphology was not observed, lateral attack of the EC layer was limited and blistering of the E-coat did not occur at that location (Fig. 19). It is interesting to note that dome-like outward protrusions at the surface have been reported for the corrosion of bare WE43 (e.g. Reference 56), and it is possible that this behavior may contribute to the blistering observed on scribed EC + E-coated WE43.
In the EC + E-coated ZE10A, both lateral attack and undercutting of the EC layer at the alloy-EC interface were observed, resulting in greater extent of attack. Similar undercutting has been reported for multi-layer coatings on ZEK 100 using a similar initial PEO treatment as the present work.15 In contrast, although lateral attack of the EC layer at the scribed material interface was observed for EC + E-coated AZ91D and AZ31B, the alloy-EC interfaces remained intact with no undercutting observed, consistent with their greater degree of corrosion resistance after scribing. Further work will be needed to better understand the attack mechanisms and role of the substrate alloy in EC + E-coated Mg alloys, but the nature of the alloy-EC and EC-E-coat interfaces appears to be critical in determining the extent of corrosion susceptibility when scribing damage is introduced.15,60 It is conceivable that the minor amount of Al introduced from the AZ91D and AZ31B alloy substrates to the EC layer (Fig. 3), as well as the possible local enrichment of Zn in the AZ91D alloy at the alloy-EC interface (Fig. 5), improved corrosion resistance or adherence of the alloy-EC interface region; however further experiments would be needed to evaluate this possibility. Incorporation of Al into corrosion films and enrichment of Zn near the alloy-corrosion film interface has been observed for Mg-Al-Zn alloys exposed in water, and linked to improved aqueous corrosion resistance.53 Full understanding of the alloy-EC and EC-E-coat interfaces will be critical to both optimizing coating processing for a given Mg alloy substrate and/or design Mg alloys to be more amenable to coating, as well as to guide lifetime modeling efforts to predict corrosion behavior of coated components.
Conclusions
State-of-the-art commercial EC coatings with and without an E-coat overlayer were studied on commercial AZ31B, AZ91D, ZE10A, and WE43 Mg alloys using the same coating parameters. The samples were characterized as-coated and after 7 or 15 day immersion in 0.1 M NaCl(aq) by multiple techniques, with an emphasis on analytical electron microscopy.
(1) The Mg alloy substrate significantly impacted EC thickness and morphology, but had only a seemingly minor impact on EC chemistry. Within each materials type, the higher RE + Zr levels (WE43) and higher Al levels (AZ91D) resulted in thicker coatings. The EC structure could be interpreted as duplex for AZ31B, AZ91D, and ZE10A, with a thin, inner continuous layer and an outer, thicker porous layer. For WE43, a highly striated inner EC region was formed, consisting of multiple thin, continuous layers and an outer, thick porous layer. The EC chemistry was primarily Mg-F rich with minor amounts of O and AM for all four alloys. Aluminum was also detected in the EC formed on the Mg-Al-Zn type AZ31B and AZ91D alloys, in excess of the levels observed in the EC on ZE10A and WE43, suggesting incorporation from the Al containing substrate alloys to the EC.
(2) The porous nature of the EC layer precluded significant improvement in corrosion resistance with only the EC coating; but provided for a potentially robust interface on subsequent E-coat processing, with percolation of E-coat throughout the porous structures.
(3) Despite differences in bare and as EC coated corrosion resistance, with AZ91D and WE43 showing better resistance than AZ31B and ZE10A, E-coat processing resulted in good corrosion resistance in 0.1M NaCl (aq) for all four alloys studied. However, after scribing, better corrosion resistance was observed for the Mg-Al-Zn type alloys AZ31B and AZ91D compared to the RE + Zr alloys ZE10A and WE43.
(4) The EC + E-coated alloys exhibited different modes of damage and susceptibility to corrosion attack from scribing. The striated inner EC layer formed on WE43 was hypothesized to result in delamination of the coating structure on scribing, making it susceptible to widespread corrosion attack and blistering extending well outside of the scribed region. The EC + E-coated ZE10A suffered from both lateral attack of the EC layer at the scribed region interface and undercutting attack of the alloy-EC interface. In contrast, for the EC + E-coated AZ31B and AZ91D, although lateral attack of the EC layer was observed at the scribed region interface, the alloy-EC and EC-E-coat interfaces remained more robust, resulting in improved resistance to corrosion. It was speculated that minor incorporation of Al from the AZ31B and AZ91D substrates into the EC layer may have improved corrosion resistance or adherence of the alloy-EC interface regions.
Written by Michael P. Brady4,1, Donovan N. Leonard1, Elizabeth A. McNally2, Joseph R. Kish2, Harry M. Meyer III1, Ercan Cakmak1 and Bruce Davis3
- Oak Ridge National Laboratory, Oak Ridge, Tennessee, USA
- Centre for Automotive Materials and Corrosion, McMaster University, Hamilton, ON L8S 4L8, Canada
- Luxfer Graphic Arts, Madison, Illinois, USA
Acknowledgments: This research was sponsored by the U.S. Department of Energy, Energy Efficiency and Renewable Energy Vehicle Technologies Office. This manuscript has been authored by UT-Battelle, LLC under Contract No. DE-AC05-00OR22725 with the U.S. Department of Energy. The United States Government retains and the publisher, by accepting the article for publication, acknowledges that the United States Government retains a non-exclusive, paid-up, irrevocable, world-wide license to publish or reproduce the published form of this manuscript, or allow others to do so, for United States Government purposes. The Department of Energy will provide public access to these results of federally sponsored research in accordance with the DOE Public Access Plan (http://energy.gov/downloads/doe-public-access-plan). The authors thank Jay Jun, Sebastien Dryepondt, and Bruce Pint for helpful comments on the manuscript. Tyson Jordan, and Tracie Lowe are thanked for their assistance with the experimental work. The authors also thank Omar Abu-Shanab, John Kukalis, Kirk Kramer, and Bruce Goodreau of Henkel Corporation for providing the coatings used in this project.
References
1. A. A. Luo, JOM-Journal of the Minerals Metals & Materials Society, 54, 42 (2002).
2. C. Blawert, N. Hort, and K. U. Kainer, Transactions of the Indian Institute of Metals, 57, 397 (2004).
3. I. Johnson and H. Liu, Plos One, 8(6), e65603 (2013).
4. B. Sakintuna, F. Lamari-Darkrim, and M. Hirscher, International Journal of Hydrogen Energy, 32, 1121 (2007).
5. P. Saha, M. K. Datta, O. I. Velikokhatnyi, A. Manivannan, D. Alman, and P. N. Kumta, Progress in Materials Science, 66, 1 (2014).
6. N. Birbilis, G. Williams, K. Gusieva, A. Samaniego, M.A. Gibson, and H. N. McMurray, Electrochemistry Communications, 34, 295 (2013).
7. R. L. Liu, M. F. Hurley, A. Kvryan, G. Williams, J. R. Scully, and N. Birbilis, Scientific Reports, 6, 12 (2016).
8. W. Q. Xu, N. Birbilis, G. Sha, Y. Wang, J. E. Daniels, Y. Xiao, and M. Ferry, Nature Materials, 14, 1229 (2015).
9. I. Toda-Caraballo and P. E. J. Rivera-Diaz-del-Castillo, JOM, 67, 108 (2015).
10. G. L. Song, K. A. Unocic, M. Harry, E. Cakmak, M. P. Brady, P. E. Gannon, P. Himmer, and Q. Andrews, Corrosion Science, 104, 36 (2016).
11. R. L. Liu, J. R. Scully, G. Williams, and N. Birbilis, Electrochimica Acta, 260, 184 (2018).
12. M. Esmaily, J. E. Svensson, S. Fajardo, N. Birbilis, G. S. Frankel, S. Virtanen, R. Arrabal, S. Thomas, and L. G. Johansson, Progress in Materials Science, 89, 92 (2017).
13. X. B. Chen, N. Birbilis, and T. B. Abbott, Corrosion, 67, 035005 (2011).
14. J. E. Gray and B. Luan, Journal of Alloys and Compounds, 336, 88 (2002).
15. J. R. Kish, Z. Cano, A. Kobylecky, J. R. McDermid, and T. Skszek, Society of Automotive Engineers International, Warrendale, PA, USA, SAE Technical Paper 2015-01-0738, (2015).
16. A. Atrens, G. L. Song, M. Liu, Z. M. Shi, F. Y. Cao, and M. S. Dargusch, Advanced Engineering Materials, 17, 400 (2015).
17. M. P. Brady, W. J. Joost, and C. D. Warren, Corrosion, 73, 452 (2017).
18. I. Milosev and G. S. Frankel, Journal of the Electrochemical Society, 165, C127 (2018).
19. J.Zhang,Z.H.Xie,H.Chen,C.Hu,L.X.Li,B.N.Hu,Z.W.Song,D.L.Yan,and G. Yu, Surface & Coatings Technology, 342, 178 (2018).
20. K. H. Dong, Y. W. Song, D. Y. Shan, and E. H. Han, Materials and Corrosion- Werkstoffe Und Korrosion, 69(4), 481 (2018).
21. Z. W. Yan, Z. J. Tan, and X. J. Yuan, Surface Engineering, 34, 885 (2018).
22. Y. H. Gao, A. Yerokhin, and A. Matthews, Surface & Coatings Technology, 269, 170 (2015).
23. H. H. Elsentriecy, J. Qu, H. M. Luo, H. M. Meyer, C. Ma, and M. F. Chi, Thin Solid Films, 568, 44 (2014).
24. R. G. Hu, S. Zhang, J. F. Bu, C. J. Lin, and G. L. Song, Progress in Organic Coatings, 73, 129 (2012).
25. G.L.SongandZ.M.Shi,CorrosionScience,85,126(2014).
26. R.Arrabal, E.Matykina, T.Hashimoto, P.Skeldon,and G.E.Thompson, Surface&Coatings Technology, 203, 2207 (2009).
27. R. Arrabal, E. Matykina, P. Skeldon, G. E. Thompson, and A. Pardo, Journal of the Electrochemical Society, 155, C101 (2008).
28. R. Arrabal, E. Matykina, F. Viejo, P. Skeldon, and G. E. Thompson, Corrosion Science, 50, 1744 (2008).
29. V. Birss, S. Xia, R. Yue, and R. G. Rateick, Journal of the Electrochemical Society, 151, B1 (2004).
30. E. Cakmak, K. C. Tekin, U. Malayoglu, and S. Shrestha, Surface & Coatings Technology, 204, 1305 (2010).
31. L.M.Chang,JournalofAlloysandCompounds,468,462(2009).
32. Y.Chen,Y.Yang,W.Zhang,T.Zhang,andF.Wang,JournalofAlloysandCompounds, 718, 92 (2017).
33. G. B. Darband, M. Aliofkhazraei, P. Hamghalam, and N. Valizade, Journal of Magnesium and Alloys, 5, 74 (2017).
34. A.Ghasemi,V.S.Raja,C.Blawert,W.Dietzel,andK.U.Kainer,Surface&Coatings Technology, 204, 1469 (2010).
35. R.O.Hussein,X.Nie,andD.O.Northwood,ElectrochimicaActa,112,111(2013).
36. D. Y. Hwang, Y. M. Kim, D. Y. Park, B. Yoo, and D. H. Shin, Electrochimica Acta, 54, 5479 (2009).
37. Y. G. Ko, S. Namgung, and D. H. Shin, Surface & Coatings Technology, 205, 2525 (2010).
38. L. R. Krishna and G. Sundararajan, JOM, 66, 1045 (2014).
39. C. C. Liu, T. Xu, Q. Y. Shao, S. Huang, B. L. Jiang, J. Liang, and H. T. Li, Journal of Alloys and Compounds, 784, 414 (2019).
40. U. Malayoglu and K. C. Tekin, Surface Engineering, 31, 526 (2015).
41. Y. Mori, A. Koshi, and J. S. Liao, Corrosion Science, 104, 207 (2016).
42. T. Narayanan, I. S. Park, and M. H. Lee, Journal of Materials Chemistry B, 2, 3365 (2014).
43. G. Shim, Korean Journal of Metals and Materials, 55, 296 (2017).
44. S. L. Sinebryukhov, A. S. Gnedenkov, D. V. Mashtalyar, and S. V. Gnedenkov, Surface & Coatings Technology, 205, 1697 (2010).
45. K. C. Tekin, U. Malayoglu, and S. Shrestha, Surface & Coatings Technology, 236, 540 (2013).
46. P. Tian, F. Peng, D. H. Wang, and X. Y. Liu, Regenerative Biomaterials, 4, 1 (2017).
47. Y. Wang, X. Wang, T. Zhang, K. Wu, and F. Wang, Journal of Materials Science & Technology, 29, 1129 (2013).
48. F. F. Wei, W. Zhang, T. Zhang, and F. H. Wang, Journal of Alloys and Compounds, 690, 195 (2017).
49. R. C. Zeng, J. Chen, W. Dietzel, N. Hort, and K. U. Kainer, Transactions of Nonferrous Metals Society of China, 17, S166 (2007).
50. S. Stojadinovic, R. Vasilic, J. Radic-Peric, and M. Peric, Surface & Coatings Technology, 273, 1 (2015).
51. X. P. Niu, T. Skszek, M. Fabischek, and A. Zak, Mater. Sci. For., 431, 783 (2014).
52. M. P. Brady, D. N. Leonard, H. M. Meyer, J. K. Thomson, K. A. Unocic, H. H. Elsentriecy, G. L. Song, K. Kitchen, and B. Davis, Surface & Coatings Technology, 294, 164 (2016).
53. K. A. Unocic, H. H. Elsentriecy, M. P. Brady, H. M. Meyer, G. L. Song, M. Fayek, R. A. Meisner, and B. Davis, Journal of the Electrochemical Society, 161, C302 (2014).
54. R. M. Asmussen, W. J. Binns, P. Jakupi, and D. Shoesmith, Corrosion, 71(2), 242 (2015).
55. Z. P. Cano, M. Danaie, J. R. Kish, J. R. McDermid, G. A. Botton, and G. Williams, Corrosion, 71(2), 146, (2015).
56. P.-W. Chu and E. A. Marquis, Corrosion Science, 101, 94 (2015).
57. S. Verdier, N. van der Laak, S. Delalande, J. Metson, and F. Dalard, Applied Surface Science, 235, 513 (2004).
58. T. Narayanan, I. S. Park, and M. H. Lee, Journal of Materials Chemistry B, 2, 3365 (2014).
59. E. Gulbrandsen, J. Tafto, and A. Olsen, Corrosion Science, 34, 1423 (1993).
60. S. L. Sinebryukhov, A. S. Gnedenkov, D. V. Mashtalyar, and S. V. Gnedenkov, Surface & Coatings Technology, 205, 1697 (2010).