With the increasing number of electric vehicles, there is a surging need for specialized coatings and components to guarantee both functionality and safety.
Simultaneously, it is imperative that these coatings do not undermine the overall performance of the EV.
Given that approximately 40% of an EV’s cost comprises the battery, it becomes absolutely essential to safeguard the battery with appropriate coatings to uphold its longevity and the vehicle’s efficiency.
E-Coating Applied to Battery Tray
This objective can be accomplished by applying dielectric coatings during an electrophoretic, commonly known as the e-coating process: e-coats are handled in liquid form, where the coating material resides in a bath. This material is positively charged, while the parts immersed in the bath are negatively charged. The electrostatic attraction between these charges facilitates the adherence of the coating to the parts.
The e-coat application system stands out for its robustness, ensuring consistent coverage of intricate parts and shapes, high productivity, relatively lower long-term maintenance costs, and efficient material utilization with minimal solid waste.
Essentially, e-coat systems excel in handling large- scale production components such as lids, trays, frame plates, module racking, and similar items. While offering various advantages, e-coating may encounter certain challenges, including uneven thickness, compatibility issues between deposited and substrate materials, and the performance comparison with more environmentally friendly alternative solutions.
Through comprehending the process, fine-tuning operational parameters, and tackling obstacles, manufacturers can unlock the complete potential of e-coating, enhancing their production capabilities and ensuring the delivery of top-tier products.
Unleashing the power of Computer Aided Engineering
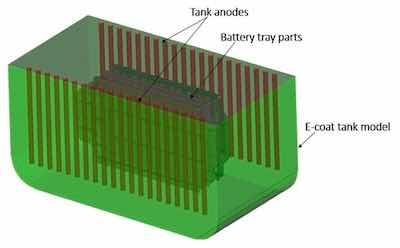 Fig.1. A digital twin model of the e-coat tank was created for the e-coat simulation purposes.This is where Computer Aided Engineering (CAE) approach proves invaluable assistance in achieving efficient and effective e-coating process performance.
CAE is a predictive computer modeling approach that enables the assessment of the performance and quality of the e-coating process prior to its implementation in a production environment. By embracing the CAE method, a notable reduction in the number of process iterations can be attained, resulting in quicker and more economical production as the necessity for wet testing can be minimized.
Additionally, by pinpointing possible process risks and performance limitations at the stage of process design, CAE can help in addressing these risks, thereby ensuring superior coating quality. Overall, the adoption of the CAE method provides substantial benefits in terms of cost, precision, innovation, and sustainability, making it essential tool for modern engineering practices.
Introducing Elsyca ECoatMaster
The e-coating CAE is executed with the Elsyca ECoatMaster tool, a developed in-house cutting-edge graphical simulation platform.
E-coating simulations are conducted using a digital twin model of the real e-coat tank setup. This includes a 3D model of the part undergoing processing, tank configuration, process parameters, and the paint solution used. The Elsyca E-CoatMaster simulation technology uses Finite Element Analysis (FEA) to solve the distribution of the current density and calculate the paint layer thickness using Faraday’s law. Detailed information on the paint layer thickness distribution and quality results (under and over-e-coated surface areas) are available for every part on the flight bar.
The simulation results demonstrate high accuracy, which is validated by comparing them with field measurements. This high accuracy is achieved through comprehensive electrochemical analysis of the paint solution, offering unparalleled insights into its performance.
Moreover, the optimal operating parameters of the process are also determined, ensuring the attainment of the desired surface quality while effectively preventing deposit defects such as inadequate coverage.
Uncovering the E-Coat Process Performances
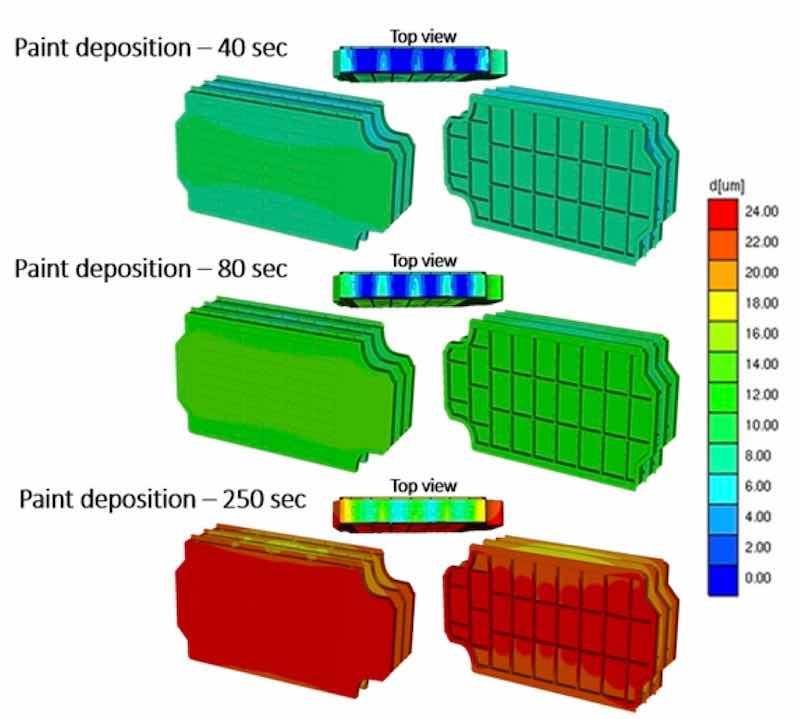 Fig.2. Simulated paint layer thickness distribution as a function of the e-coating time. Fig.4. Simulated current density distribution as a function of the e-coating time.This technology has been used to assess the e-coat process performance of the EV battery trays, focusing on current density and paint layer thickness distributions. Figures 2 and Figure 3 illustrate the distribution of paint layer thickness corresponding to the process time.
The color-coded mapping highlights notable disparities in paint thickness across the parts, revealing areas with under-deposition (depicted in blue) and over-deposition (depicted in red). On the other hand, Figure 4 displays the corresponding distribution of current density, highlighting areas with high and low current densities on the e-coated parts. This straightforward analysis reveals evident e-coat quality issues, indicating that there might be potential for improvement.
Optimization strategies tailored to the functionality of the e-coat process setup can subsequently be implemented by enhancing the process scenario and reiterating simulations.
Visit www.elsyca.com.
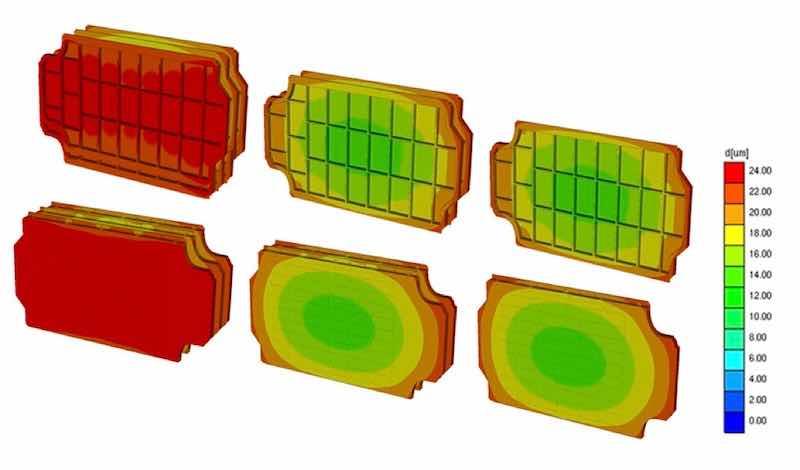 Fig.3. Simulated paint layer thickness distribution over each battery tray part on the flight bar. E-coating time = 250 sec.
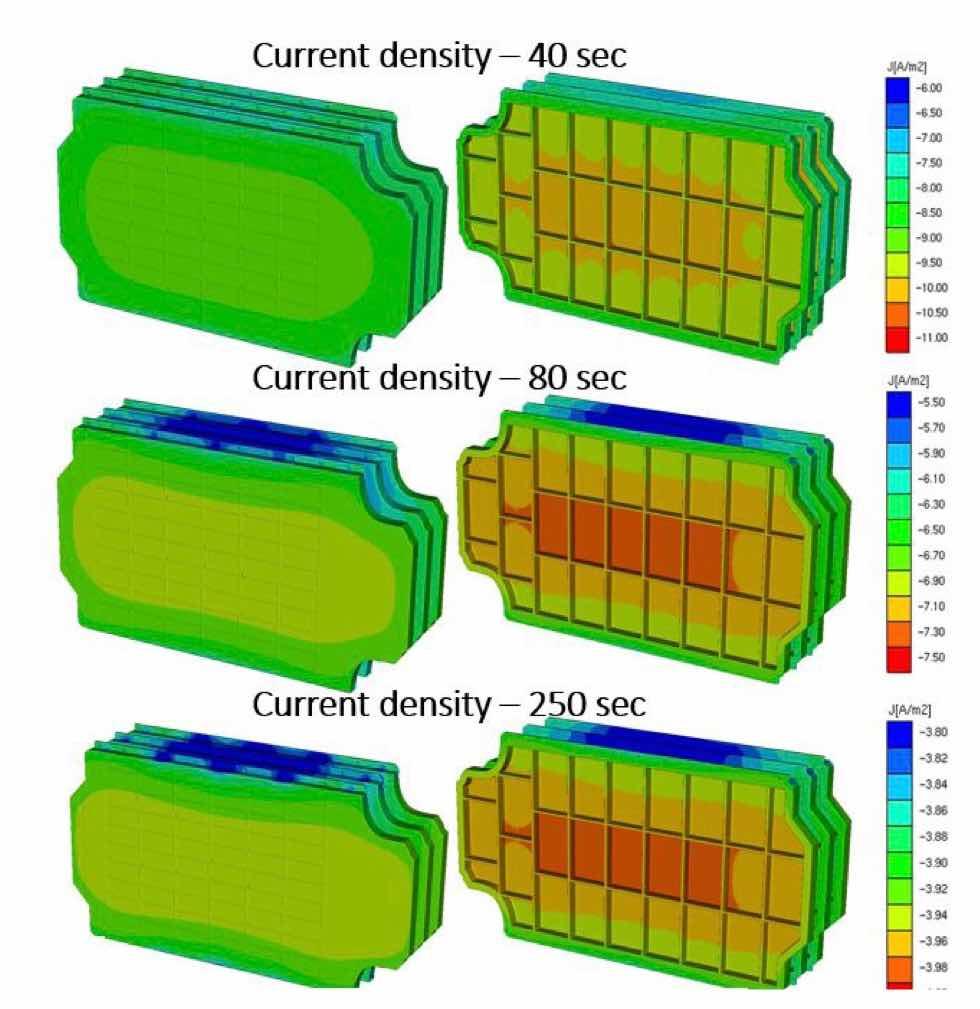 Fig.4. Simulated current density distribution as a function of the e-coating time.