


In this work, a method based on UV–VIS spectrophotometry using the molybdenum blue reaction is described to monitor hypophosphite and phosphite levels in nickel electroless baths.
Nickel is one of the most employed metals in the electroless coating industry and during the deposition process the metal is reduced from Ni (II) to Ni (0). Hypophosphite is a widely employed reducing agent, which is oxidized to phosphite. Therefore, the hypophosphite concentration should be monitored in order to replenish the bath while it is being consumed maintaining an optimum concentration in order to guarantee the desired coating. Phosphite, which could interfere with the coating process, must be monitored to ensure it does not exceed a certain concentration after which the bath stops working. Although iodometric titrations are the most commonly used methods to control hypophosphite and phosphite concentrations, these are time- and reagent-consuming.
 Albizu, Bordagaray, Garcia-Arrona, and Vidal.Thus, with the aim of developing a more appropriate methodology a colorimetric determination was carried out in this work. In certain conditions, the hypophosphite reacts with molybdenum, giving rise to a blue compound that can be measured between 390 and 1100 nm. The phosphite presence modifies the obtained spectra and that effect allows individual Partial Least Square (PLS) models to be built for each analyte. In this study, the calibration, cross-validation and external prediction relative error were always lower than 8%, and the relative standard deviation lower than 12%. The models were applied to real samples from two different nickel electroless baths, and the results were compared and validated using ion chromatography (IC). No significant differences were observed between the proposed and the reference methods for either of the two analytes. Therefore, the colorimetric method could be an improvement over the methods currently used for the control of the two anions in coating baths in term of saving time, money and reagents, making the coating process more efficient.
1. Introduction
Nickel electroless plating is widely used in industrial applications due to its high resistance to corrosion and wear, particular hardness, and good lubricity. In contrast to an electroplating method, where an external current source is required to reduce the nickel ion to nickel metal, in an electroless deposition a reducing agent is employed. In many cases, sodium hypophosphite is the compound used as a reducing agent, and its use leads to nickel‑phosphorus (Ni — P) alloys, which have remarkable corrosion resistance, high hardness, as well as great homogeneity and adhesion to the substrate [1]. Despite electroplating methods being one of the most economical processes, with electroless methods a more uniform thickness of the coating is obtained, this being one of the major advantages of electroless techniques, since the electroplating method are not capable of coating different parts of an object with complex geometry with the same density [2]. Another difference between the two processes is that when an electric current is used, the percentage of nickel in the coating is almost 100%, whereas when a reducing agent such as sodium hypophosphite is employed, phosphorus is deposited together with the metal [3]. This makes it possible to incorporate different particles or a third element into the Ni—P coating, enhancing its properties [4,5]. It should also be noted that in electroless baths the concentration of the metal and the reducing agent decrease as the deposition is carried out; however, during the electroplating process, the nickel adhered to the surface to be coated is compensated by the dissolved nickel from the anode [6]. The possibility of coating non-conductive substrates is an excellent additional benefit of chemical nickel plating, which expands the potential range of applications for this kind of procedure [7,8].
The Ni—P plating mechanism is not well defined and there are several models for describing the process, but in all of them phosphite is produced due to the oxidation of the hypophosphite [9]. As has been mentioned, hypophosphite is used not only as a reductant to obtain Ni—P coatings. It is also employed in copper electroplating baths, for example, where Ni — P — Cu alloys are deposited, and the hypophosphite concentration influences the deposition rate and therefore the final coating [10]. Hypophosphite has also been used to obtain composite coatings, such as Ni-P/PTFE coating, which increases the resistance to corrosion by co-depositing polytetrafluoroethylene (PTFE) particles with the metal [11].
Even though electroless bath control is more difficult than electroplating, Ni—P coatings are a good alternative to hard chromium, which involves health and environmental issues [12]. Based on the percentage of P in the deposition, three groups of coatings are distinguished: low-, medium-, and high‑phosphorus coatings, which contain phosphorus contents of 2–5 wt%, 6–9 wt%, and >10 wt% respectively. Different properties can be reached, since low-phosphorus coatings have a higher hardness value, and higher density and crystallinity, while high-phosphorus coatings show greater corrosion resistance [13]. Although the amount of phosphorus deposited does not depend only on the hypophosphite concentration but also on other factors such as temperature, stabilizers, or complexing agents. It has also been shown that the Ni2+/H2PO2− molar ratio also influences the final deposition and coating. This is because the amount of phosphorus in the coating increases as the concentration of the anion increases, up to a point where the co-deposited phosphorus decreases [14,15]. The Ni2+/H2PO2 − molar ratio should be maintained between 0.25 and 0.60, and ideally between 0.30 and 0.45 [6]. Furthermore, when hypophosphite concentration growth, the deposition rate also increases [16], and even a very high concentration results in a bulk deposition of the nickel ions decreasing the stability of the bath [17]. As a consequence, controlling the hypophosphite concentration is essential for the continuous operation of the plating bath, and as the depleted hypophosphite as well as the nickel have to be replenished to maintain their concentration in the optimum conditions it is very important to be able to measure their concentrations.
On the other hand, the phosphite produced in the bath over time as a by-reaction product is undesirable. Phosphite accumulates steadily in the plating bath, and it can start competing with the complexing agent for nickel ions, forming nickel phosphite. The optimal functioning of the bath declines when the phosphite concentration reaches 30 g/L (0.38 M). For every gram reduction of nickel, 4 g of phosphite are formed, rendering the bath inoperable for some applications after three turnovers. However, the maximum phosphite tolerance can be increased up to between 150 and 250 g/L (1.9 and 3.1 M respectively) by adding complexing agents to prevent the precipitation of the nickel phosphite [6]. In short, to extend the life of a bath, it is essential that the phosphite is removed [18] or at least reduced to a tolerable level [6]. Regarding the final coating, there is a definite correlation between the phosphite concentration and the internal stress of Ni—P deposits, which becomes more tensile as the phosphite concentration increases, making the coating not so useful for applications where corrosion resistance is important [19]. Furthermore, a high concentration of phosphite in the bath can increase the percentage weight of phosphorus in the deposit by 1% or 2% [6].
To control the concentration of hypophosphite, phosphite and nickel, titrations are commonly carried out in the coating industry [20,21]. For hypophosphite and phosphite excess iodine is frequently used as an oxidation titration agent. The remaining iodine is then titrated with thiosulfate, using starch as an indicator, and the concentration of the analyte of interest is calculated by measuring the difference. To measure hypophosphite, the pH of the sample must be acidic, whereas to measure phosphite, the samples have to be adjusted to neutral or alkaline condition. In any case, during these titrations it is important to keep the beaker or the Erlenmeyer flask, where the titration is going to take place, for at least 30 min in darkness after the addition of the iodine [[22], [23], [24]], making the titration a long procedure. Additionally, several milliliters of the plating bath are usually consumed in this process. There are commercial systems that monitor this process [25], but the sample amount required is also high. For nickel, EDTA (ethylene diamine tetra acetic acid) is commonly used in a back-titration process [[26], [27], [28]]. Another technique that has been used to determine these compounds in this kind of sample is ion chromatography (IC) [[29], [30], [31], [32], [33]], even coupled to inductively coupled plasma emission spectroscopy (IC-ICP-ES) [34], capillary electrophoresis (CE) [35], indirect measurement of phosphite by an electrode selective to sodium [36] or nickel deposition rate by the addition of different oxyanions to quantify hypophosphite [37].
Further, when a spectrophotometric method is used to measure hypophosphite and phosphite, it typically relies on a prior oxidation of these compounds to phosphate and the determination of the latter by the molybdenum blue method [22,38,39]. Indeed, the kinetics and mechanism of the oxidation of phosphite and hypophosphite with polyoxometalates have been researched in the literature. In 2008 V.M Gurame and G.S. Gokavi [40] studied the reaction between hypophosphite and enneamolybdomanganate (IV) in perchloric acid, where hypophosphite competes with MnO6 to form complexes with molybdate ions. G.S. Gokavi et al. [41] studied the oxidation of both anions by hexamolybdocobaltate (III) in an acidic environment in 2015. Finally, indirect spectrophotometric measurements have also been reported [42].
Some works have also detailed the determination of hypophosphite by the formation of a blue complex between this compound and ammonium molybdate. If sulphurous acid is used, phosphite does not interfere but phosphate does [43]. If the acid normality is adjusted, for example by using hydrochloric acid, the interference of phosphate is also removed [44]. Several old patents describing methods to determine either hypophosphite or phosphite in plating baths have also been found. The patent of G. Gutzeit published in 1953 [45] describes a colorimetric procedure to determine hypophosphite in nickel plating baths based on the formation of a blue color by the addition of boric acid, a reducing agent, and a mixture of molybdic and sulfuric acid. After the addition, the mixture had to be introduced in a hot-water bath at 50°C for at least 30 min so that the color was able to develop sufficiently to be measured by a spectrophotometer with a red filter. It is believed that phosphite does not interfere in the reaction if its concentration is not too high. The patent published by M.C. Lambert and R. Wash in 1974 [46] focuses on the determination of hypophosphite by previously deactivating the interference of phosphite with enough acidification, and by adding Fe3+ ions to the sample afterwards with the objective of producing a colored ferrous complex to determine hypophosphite photometrically. The patent of M. Pavlov et al. of 2004 [47] describes how to use the measurement of the effect of a plating reducing agent, such as hypophosphite, on the deposition rate of nickel or a second added metal, and the patent of J.S. Golden et al. of 2004 [48] proposes a method to determine hypophosphite by Raman spectroscopy. Finally, the patent of A. W. Grobin et al. of 1969 [49] describes a testing method to determine phosphite in a sample, in which hypophosphite is also present. The procedure consists in the addition of an acid buffered metal anion solution to the sample, capable of forming colored heteropoly acids with phosphorous containing compounds, and later another addition of a reducing agent for phosphite, such as ascorbic acid, isoascorbic acid, hydroquinone or p-methylaminophenol sulfate. The intensity of the resulting colored heteropolyphosphite complex is later measured by colorimetry between 740 nm and 770 nm.
However, no works have been found which address the simultaneous determination of both compounds, hypophosphite and phosphite. The method described here proposes a fast and simple procedure to determine the two chemicals based on the use of the UV–Vis spectrophotometry. It can be accomplished by taking just few microliters from the bath and the measurement can be achieved in little over five 5 min. That is a great advantage over previous methods, especially from the most frequently used titration, which requires several milliliters of the bath and the sample being in the dark for 30 min. Furthermore, the procedure could be easily automatized.
2. Experimental section
2.1. Chemicals and reagents
To produce the colorimetric reaction, acid solution, ammonium molybdate, reducing agent and stocks solutions of H2PO2− 10 mM and HPO2/3− 45 mM, from pure NaH2PO2·H2O and Na2HPO3·5H2O respectively, were prepared. For the bath control and preparation NaOH 10%, HCl 18% and H2SO4 25% were used. To perform the nickel, phosphite and hypophosphite titrations, EDTA 0.025 M, NH3 30%, KI, KIO3 0.016 M, I2, murexide, Na2S2O3 0.1 M, NaHCO3 2% and starch 1% were used.
The mobile phase solution used for ion chromatography was a 3.6 mM Na2CO3 solution. In this case, 250 mg/L H2PO 2− and HPO2/3− stocks solutions were prepared to perform the calibration curves and SO2/4− 25 mM and oxalate 5 mM were also made from the respective acids.
All chemicals were of analytical reagent grade (Panreac, Sigma-Aldrich or Probus) and double-distilled water was used throughout the experiments for UV–Vis spectrophotometry and titrations and Milli-Q water for ion chromatography.
2.2. Apparatus and software
The measurements in the UV–Vis spectrophotometer were made with an Agilent 8453 UV–Vis spectrophotometer with a diode-array detector (Agilent Technologies, Switzerland) and the HP UV–Vis Win System software. All spectra were registered between 190 and 1100 nm every 1 nm. For ion chromatography an 883 Basic IC plus Metrohm (Metrohm AG, Switzerland) chromatographer coupled to a conductivity detector was used. The software MagIC Net 3.2 was used for data acquisition and processing. The employed column was an anionic A Metrosep A-supp 5 column and before any measurement, standards and samples were filtered with 0.45 μm nylon filters. The real samples were also filtered with Inline Cation Exchange IC-H sample preparation cartridges from Metrohm. Micropipettes Eppendorf (Spain) were used throughout and calibrated regularly. For chemometric data treatment Unscrambler X 10.5.1 Client (CAMO Software, AS, Oslo, Norway) and MATLAB R2020b (The MatWorks, Natick, MA, USA) with the PLS-Toolbox 89 (Eigenvector Research Inc. West Eaglerock Drive, Wenatchee, WA, USA) were used.
2.3. Color formation
When hypophosphite and ammonium molybdate are combined at a low pH and a reducing agent is added, an intense blue color appears. The acid solution is always used in the same amount to control the pH, which must always be less than one.
The kinetic of the reaction is recorded for 10 min and the spectra between 190 and 1100 nm are registered every 10 s. The color intensifies over time, so it is important to start the measurement always at the same time, in this case 5 s after the addition of the reducing agent. It is also essential that the concentration of the ammonium molybdate in the cuvette is significantly higher than that of the hypophosphite, and it should be kept constant, otherwise the reaction rate could change. Additionally, temperature should be controlled in the cuvette because the higher the temperature, the faster the reaction is. However, at a controlled room temperature (22°C) the results are also satisfactory.
It has been observed that only the hypophosphite produces a colored complex with the molybdenum under the reaction conditions. In any case, the presence of phosphite in the samples slightly modifies the obtained spectra, by shifting the hypophosphite band to higher wavelengths and by diminishing the signal. The higher the phosphite, the bigger the modification is. This was used in this work to determine both compounds simultaneously through multivariate regression.
2.4. Preparation and measurement of the calibration matrix and building of the PLS models
In order to determine both compounds simultaneously by UV–Vis spectrophotometry, a calibration matrix with different mixtures of the compounds was created. 91 calibration samples were prepared directly in the cuvette, replicates included. From these, 60 samples were included in the calibration set and 31 in the validation set for both analytes. Replicates were always included in the same set. Two stock solutions were previously prepared, one for hypophosphite (10 mM) and another one for phosphite (45 mM) to have the appropriate concentration ranges in the cuvette for both. After the addition of the appropriate volumes of both analytes to prepare the mixtures, acid solution, a variable amount of double-distilled water, so that the final volume was 2600 μL, the (NH4)6Mo7O24 solution and the reducing agent were added. Before the addition of the reducing agent, the spectrum of the blank is registered, and 5 s after its addition, spectra are registered as has been explained above.
For each analyte two independent PLS models were built using all the spectral information. The basics of PLS have been covered in depth elsewhere [50,51]. To build the best models, several signal pre-processing techniques, wavelength range selection and kinetic times were evaluated. The final chosen conditions will be detailed in the results and discussion section.
To evaluate the developed PLS models, relative errors were calculated using the following equation:
(1)
where and are the calculated and experimental concentrations respectively, for the analytes in mixture i. This relative error can be applied to the calibration (% R.E.Cal), to the cross validation (% R.E.CV) and to the external validation data (% R.E.Pred).
2.5. Bath operation and sample measurement
A proprietary Niklad 1000 (MacDermid) low phosphorus electroless nickel electrolyte was employed in this work. The electrolyte was prepared twice (bath 1 and bath 2) in a 2 L capacity cylindrical glass vessel and the volume of the electrolyte was 1.6 L. By adding NaOH 10% and H2SO4 25%, the pH of the solution was maintained at 4.8. The working temperature was set at 88°C, and coatings were produced on low carbon steel flat foils (120 × 80 × 1 mm3) for a total plating time of 1 h. Before plating, the substrates were degreased and then rinsed, and finally activated in HCl 18% solution for 1 min.
Between each coating procedure, the electrolyte was replenished, the pH readjusted to its initial value and the volume was readjusted to 1.6 L to maintain the coating surface/bath volume ratio, which was fixed at 1.2 dm2/L. With regard to replenishing the electrolyte, two aliquots of 2.5 mL were titrated with EDTA 0.025 M in the presence of murexide, to determine the Ni2+ concentration. Depending on the mean concentration obtained, Ni2+, H2PO2−, complexing agents, stabilizers and buffers were readjusted following the manufacturer's indications. After each coating, an aliquot of approximately 15 mL was taken from the bath, and occasionally also after the replenishment. In some of these aliquots, hypophosphite was titrated to confirm that it had been correctly readjusted.
In some aliquots hypophosphite and phosphite were measured both by the colorimetric method and IC. For the colorimetric method 5 μL were taken from the bath and directly added to a glass cuvette. Then the same procedure as described in Section 2.4 was followed: addition of acid, double-distilled water, ammonium molybdate and reducing agent. After 5 min, the spectrum was registered. These aliquots were also measured by IC, which was the reference method. To that end, 25 μL of the sample was diluted 1000 times and 1 mL of both H2SO4 25 mM and oxalic acid 5 mM solution were added following the Metrohm IC Application Note No. S-247. Before the measurement, the solution was filtered twice, first with an IC-H sample preparation cartridge and then with a 0.45 μm nylon filter.
2.6. Chromatographic analysis
Ion chromatography was used as reference technique for phosphite and hypophosphite quantification. Making the appropriate dilutions from the 250 mg/L standard solutions and adding 1 mL of both the H2SO4 and oxalic acid solutions, a calibration between 2 and 90 mg/L (0.03–1.4 mM for hypophosphite and 0.03–1.2 mM for phosphite) was built for both anions using the area of each analyte peak. Chromatograms of 25 min were measured (Fig. 1), and the order of the anions was the following: hypophosphite (3.85 min); phosphite (13.55 min); sulfate (15.70 min) and oxalate (18.20 min). Throughout the 25 min, a 0.8 mL min−1 flow was maintained. For the analysis of the bath samples, Metrohm IC Application Note No. S-247 was followed as has been explained in the “Bath operation and samples measurement” section.
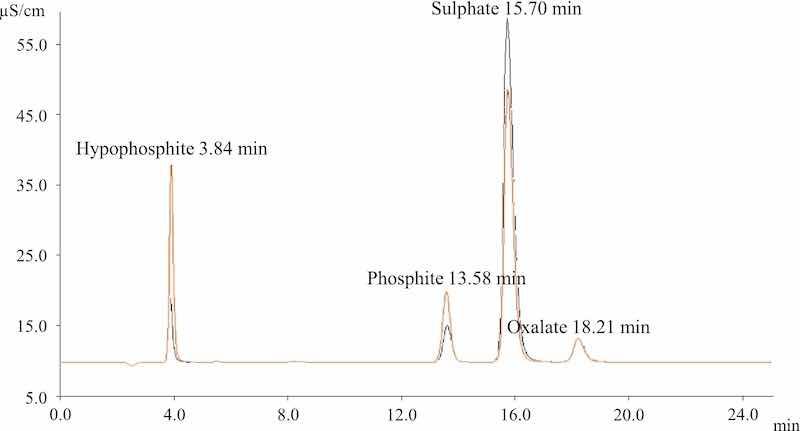 Fig. 1. In orange, a chromatogram obtained for a standard solution containing hypophosphite, phosphite, sulfuric acid and oxalic acid; in black, a chromatogram obtained from a bath sample that shows the presence of the four anions. A 0.8 mL min−1 flow was used in both cases.
2.7. Titration analysis
As titration methods are the ones used in the industry to control phosphite and hypophosphite concentrations in bath samples, they were used here to compare the results obtained by UV–Vis and IC. For both analytes, the procedure is quite similar and based on iodometric titrations. Both phosphite and hypophosphite react with an excess of triiodide (I3−) and, after keeping the solutions in darkness for 30 minutes, the remainder I3− is titrated against thiosulfate standard solution. In these titrations, the I3− excess in presence of starch gives rise to a dark blue solution, and when all the I3− reacts with thiosulfate, solutions turn colorless [52].
For hypophosphite determination, 5 mL of the bath were taken and added to an Erlenmeyer flask. The reaction between H2PO2− and the I3− takes place in an acidic environment, and after a wait of 30 min, the titration with thiosulfate is performed until the solution turns colorless. The reactions are the following:
I3− + PO23− + H2O ↔ 3I− + PO33− + 2H+ (2)
I3− + 2S2O32− ↔ 3I− + S4O62− (3)
On the other hand, for phosphite, the reaction with I3− occurs in a basic environment, so NaHCO3 was added, and after waiting 30 min, the solution was acidified with acetic acid to titrate the remaining I3−. In this case, the bath volume titrated varied between 1 and 3 mL, depending on the expected phosphite concentration, and the reactions were the following:
I3− + PO33− + OH ↔ 3I− + PO43− + H+ (4)
I3− + 2S2O32− ↔ 3I− + S4O62− (5)
3. Results and discussion
As can be seen in Fig. 2, hypophosphite reacts with ammonium molybdate at a low pH, and after having been reduced with the reducing agent, a blue complex is formed with an absorption maximum at 752 nm. The color formation is gradual, so the timing of the spectrum measurement is crucial.
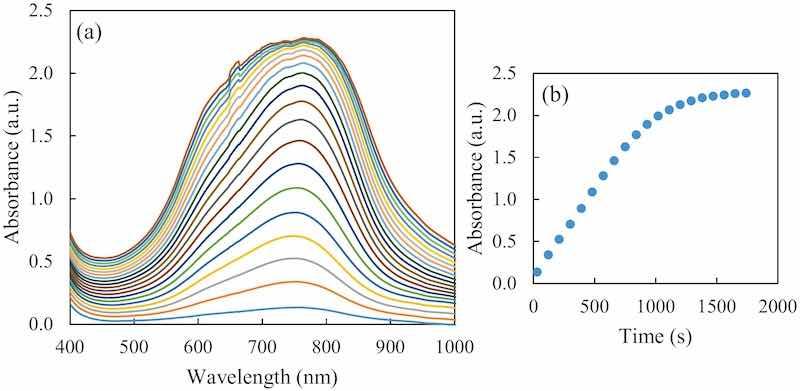 Fig. 2. (a) Evolution of the formed blue complex UV–Vis absorption spectra registered for 30 min every 90 s, for an initial 0.75 mM hypophosphite concentration. (b) The kinetics at 752 nm for the same sample during the 30 min.
When considering samples containing only hypophosphite good calibration curves can be obtained using the initial (first 10 min) formation rate absorbance values. However, as previously indicated, phosphite is able to alter the spectrum signals of the complex even if it does not produce any colored compounds under the reaction conditions, as observed in Fig. 3. Both a bathochromic and a hypochromic effect are clearly seen when bigger concentrations of phosphite are added over the same concentration of hypophosphite.
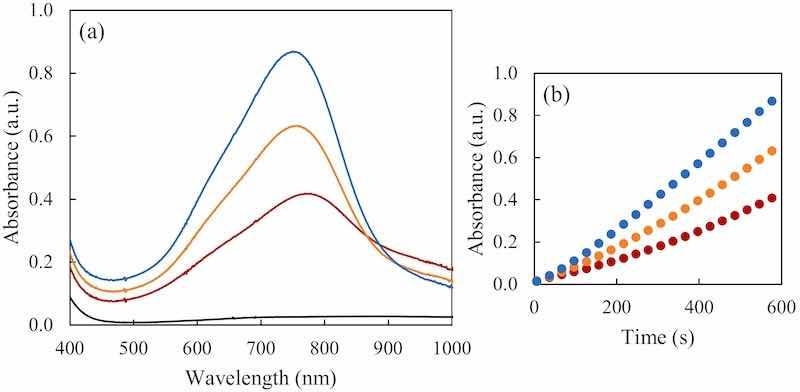 Fig. 3. The effect of the phosphite presence in the hypophosphite determination. (a) In blue, the UV–Vis absorption spectrum of 0.6 mM hypophosphite standard; in black the UV–Vis absorption spectrum of 10 mM phosphite standard at the same reaction conditions. In orange and red the UV–Vis absorption spectra of mixtures of 0.6 mM of hypophosphite and 2.5 and 4.7 mM of phosphite respectively. The entire spectra shown were taken 10 min after adding the reducing agent. (b) With same colors, the kinetics of color formation in the first 10 min of reaction at 752 nm.
This spectral alteration makes the univariate calibration impractical to control the hypophosphite concentration in real baths, since the aging of the bath leads to the appearance of phosphite in the bath, and therefore the reaction rate changes. Specifically, the higher the concentration of phosphite, the lower the speed of color formation. Nevertheless, we have used this effect to quantify both compounds simultaneously. To do that, a PLS model for each of the analytes of interest was made. Cross Validation with venetian blind procedure was used for cross validation (CV).
The collected spectra were then preprocessed using different algorithms, including Savitzky-Golay smoothing, normalization and the derivative of the spectra, the latter two with the objective of emphasizing the spectra shift produced by the presence of phosphite. The use of various spectral ranges and kinetics times were also evaluated. For the different wavelength ranges under examination models were built using the information at 5.0, 7.5 and 10.0 min. An amount of 40 spectra recorded during the ten first minutes of the reaction were used as the kinetics data. Taking into account the calibration and the cross-validation errors of the resulting models, the best ones for each analyte was selected.
No significant differences were noticed between the evaluated models at 5.0, 7.5 and 10.0 min and the one built with the kinetics data, so the final selected models for hypophosphite and phosphite were made with the spectral data acquired at 5.0 min in order to simplify and speed up the methodology. Furthermore, as it is not necessary to use kinetics data, there is no need to use spectrophotometers capable of recording kinetics.
To summarize, the best model for hypophosphite was obtained by shortening the spectral range to the 390 to 1100 nm interval and by applying Savitzky Golay smoothing (w = 15) and mean center to the measured spectra of the calibration matrix. Outliers and standards over a concentration of 0.9 mM were excluded from the model due to the loss of linearity. As a consequence, the final model included 46 standards in the calibration set and 26 in the validation one. For phosphite, however, the best PLS model was obtained for a spectral range from 450 to 1000 nm and by using Savitzky Golay smoothing (w = 15), normalization (area = 1) and mean center applied to the spectra. It should be said that concentrations of hypophosphite under 0.3 mM (the spectral signal was too low below this concentration to appreciate the shift caused by the phosphite), and under 0.9 mM of phosphite (under the limit of detection), were excluded. In summary, a total of 36 samples were included in the calibration set and 21 in the validation set.
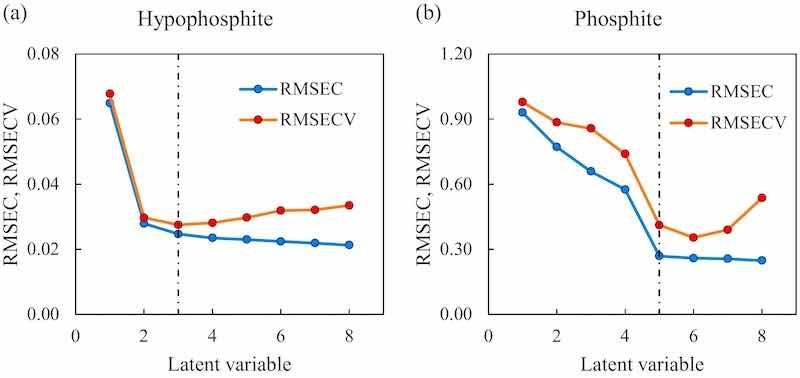 Fig. 4. On the left, the root mean square error of the model for hypophosphite and on the right, the root mean square error of the model for phosphite. In both plots, the blue data represent the root mean square error for the calibration (RMSEC), the red data the root mean square error for the cross-validation (RMSECV) and the black dashed line the selected latent variable.
The number of appropriate latent variables (LVs) for each model was selected according to an established method based on the smallest root mean square error of cross validation RMSECV [53,54], Fig. 4, that shows the variation of the calibration and cross-validation errors as the number of latent variables increase. The summary of the analytical figures of the selected models can be seen in Table 1.
Table 1. Analytical figures of merit of the developed PLS models.
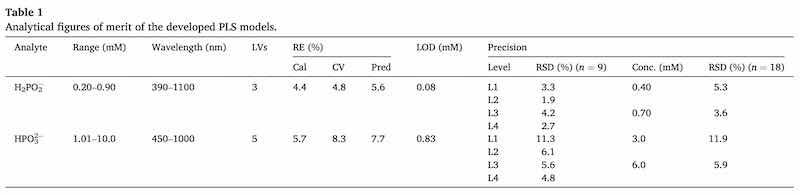
In general, it can be concluded that the obtained models are satisfactory for both analytes as the errors for calibration (Cal), cross-validation (CV) and prediction (Pred) are under 10%. These errors are slightly higher for phosphite, but this is normal considering that phosphite is only able to produce a minor change in the spectral signal of the colorimetric reaction of hypophosphite. The limit of detection (LOD) calculation was based on the reference vs predicted graph of the calibration set [55].
The precision of the method for both analytes was evaluated as well. To do that, four mixtures were prepared by triplicate in three different days (giving a total of nine measurements at each level) with the following concentrations for hypophosphite and phosphite respectively: 0.40 mM and 3.0 mM (L1); 0.70 mM and 3.0 mM (L2); 0.40 mM and 6.0 mM (L3) and 0.70 mM and 6.0 mM (L4). The procedure to do these measurements was the same as followed with the calibration mixtures. Precision was calculated by the relative standard deviation between the nine measurements carried out at each level. As can be seen from the results for each level, precision values range from 2% to 4% for hypophosphite and from 5% to 11% for phosphite, which can be considered reasonable. When precision was calculated using the 18 measurements of the same concentration for each analyte (0.40 and 0.70 mM for hypophosphite and 3.0 and 6.0 mM for phosphite), the obtained RSD (%) for the hypophosphite were 5.3% and 3.6% for the lowest and the higher concentrations respectively and 11.9% and 5.9% respectively for phosphite, which is acceptable.
The method was also applied to bath aliquots obtained along an electroless process as was explained in Section 2.5. The three techniques under comparison in this article (spectrophotometry, IC and titration) were all applied to five bath aliquots for both hypophosphite and phosphite determination. For the other four aliquots, only spectrophotometry and IC were used (Table 2). Each sample was measured in triplicate by the spectrophotometric method and in duplicate with the other two techniques.
Table 2. Predicted concentrations in nine real samples from bath 1 for both analytes expressed as the average values of replicate samples (n = 3 for UV–Vis and n = 2 for IC and titration) with their standard deviations. Number before the letter S (sample) indicates that they are aliquots from bath 1. Number after the letter S (Sample) indicates the number of coatings. Letters after underscore indicate when the samples were obtained from the bath: A = after doing the coating, B = before doing the coating and the replenishment of nickel and hypophosphite, AF = after doing the coating and filtering the bath.
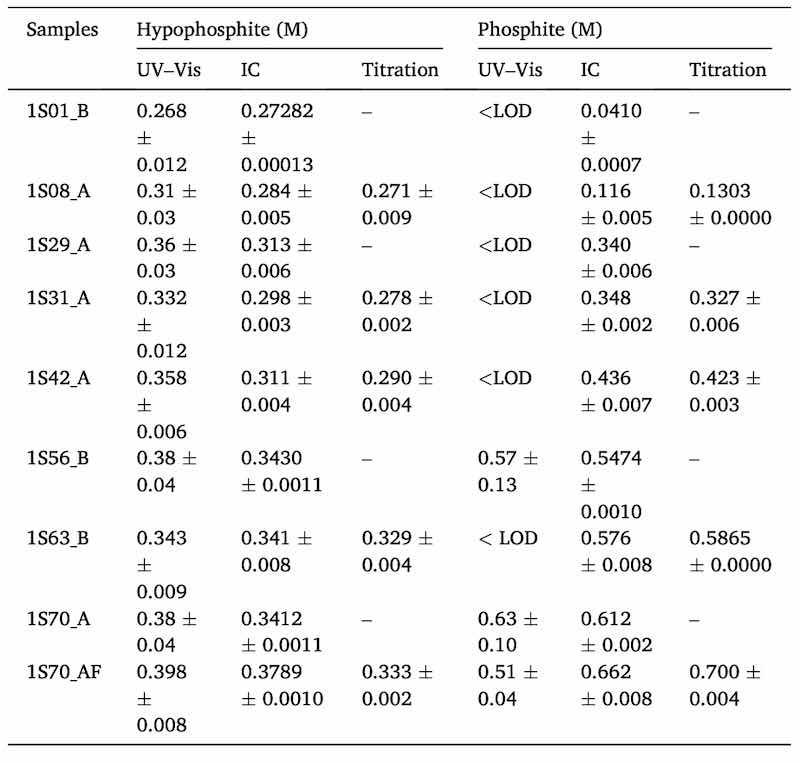
As shown in Table 2, the obtained standard deviations for the colorimetric approach were often higher than for the two references methods. In the case of phosphite, Table 2 illustrates how its concentration is increasing as the bath is getting older (from top to bottom lines). In any case, for most of the samples phosphite was under the limit of detection which means that an insufficient amount of phosphite was formed as a by-product reaction. For that reason, five bath samples from bath 2 were spiked with two different concentration levels of phosphite (L1 = 0.8 M and L2 = 1.8 M) and results are shown in Table 3. Only UV–Vis and IC were used to measure those samples.
Table 3. Predicted concentrations in five real samples from bath 2 for both analytes. Each sample was spiked with two different levels of phosphite (L1 and L2). Results are expressed as the average values of replicate samples (n = 3 for UV–Vis and n = 2 for IC) with their standard deviations. The number before the letter S (sample) indicates that they are aliquots from bath 2. The number after the letter S indicates the number of coatings. Letters after underscore indicate when the samples were obtained from the bath: A = after doing the coating, B = before doing the coating and the replenishment of nickel and hypophosphite.
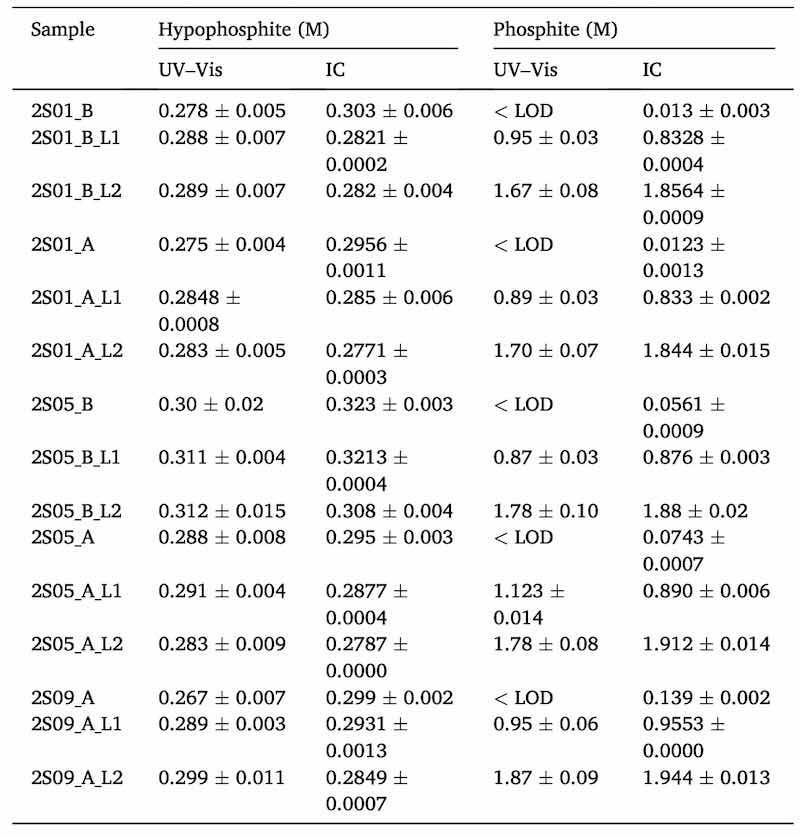
Table 3 shows some samples before (B) and after doing the coating (A). It can be seen that in the determination of phosphite by IC, an increase in the amount of this analyte is observed as the bath is getting older. As happened with samples of bath 1, quantifiable measurements were only possible by UV–Vis when samples were spiked.
To evaluate if there were significant differences between the spectrophotometry and IC t-tests for paired samples [56] were performed for a total of 24 samples (9 + 15) for hypophosphite and 13 for phosphite (after removing those in which the phosphite concentration was lower than the LOD). Those tests showed no differences at a confidence level of 95% for both analytes (for hypophosphite, tobtained = 1.47 and tcritical = 2.07; for phosphite, tobtained = 0.80 and tcritical = 2.18). This result shows that even when the presence of phosphite is high (spiked samples) the determination of hypophosphite is good.
For phosphite, a more unfavorable test was also applied, the elliptic joint confidence region [[57], [58], [59]]. This test can be only applied if the concentrations under comparison fall within a large enough interval, as in the case for phosphite. A systematic error produces a big change in the slope from unity and a change in the intercept from zero in the representation of found vs added concentration. Fig. 5 shows this test for measured UV–Vis data vs measured IC. In this case, a slope of 0.87 ± 0.11 was obtained and an intercept of 0.13 ± 0.14, Fig. 5, a). At a confidence level of 95% the ideal point of slope 1 and intercept 0 falls within the drawn ellipse (Fig. 5, b) and consequently there are no significant differences between our method, the UV–Vis spectrophotometry, and the IC, used as reference, for phosphite determination.
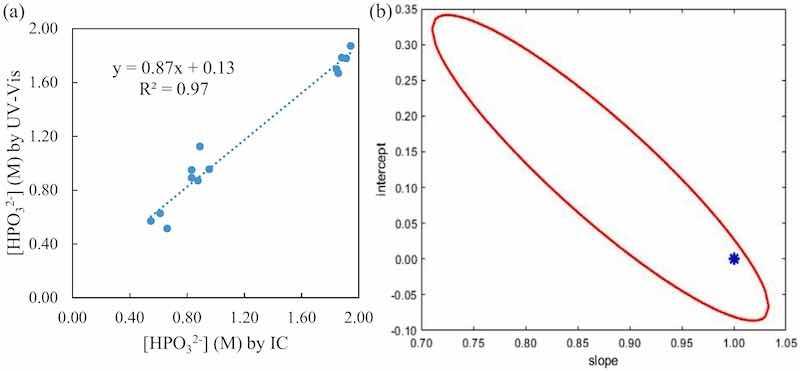 Fig. 5. (a) Found vs added plot (left) with the slop, intercept and R2. (b) The elliptical joint confidence region, in red, for the regression with a confidence interval of 95%. The blue star marks the ideal point (1,0).
Fig. 6 shows schematically the process to be followed for carrying out the determination of both anions in a sample by the proposed method. It should be taken into account that before carrying out the sample measurement, the PLS model for each anion has to be performed. As can be seen, first 5 μL of the sample must be added to the cuvette and then all the necessary reagents must be added, with the reducing agent being the last one. The UV–Vis spectrum is collected 5 min after the start of the reaction. The spectrum has to be pre-treated differently for each analyte since the optimal models have been obtained with different pre-treatments. In the case of hypophosphite, the spectrum has to be cut between 390 and 1100 nm and after smoothing it, only mean center is applied. However, for phosphite determination, the used spectral interval ranges from 450 nm to 1000 nm, and between smoothing and mean centering the data, the spectrum has to be normalized. Once this is done, the prediction of each analyte is made with its respective PLS model, and as a response, the concentration of each anion is obtained.
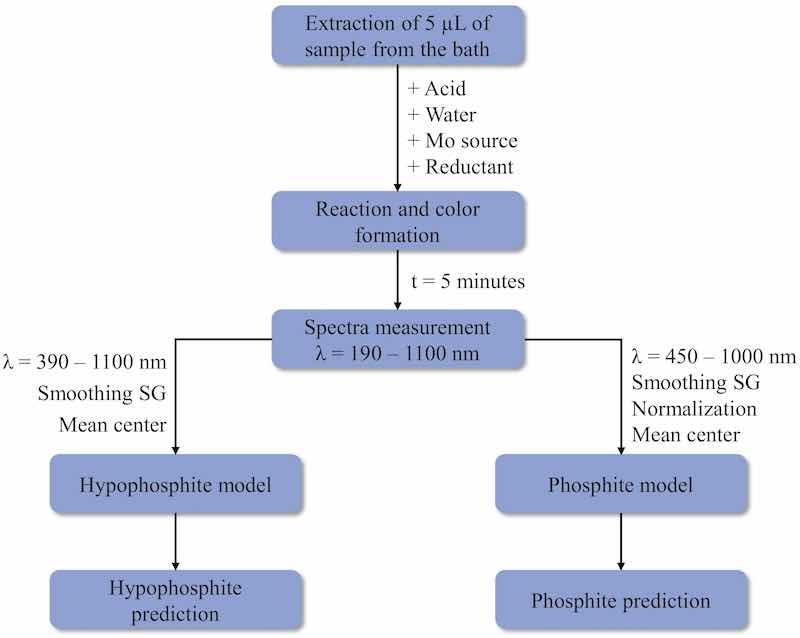 Fig. 6. Flowchart of the UV–Vis process.
In order to implement this method in a fully automated way in the industry, first of all, a pump system must be available to collect the necessary sample volume from the bath when the analysis has to be carried out. The sample should be placed in the cuvette and the volume of each of the other reagents should be added using extra pumps. Once 5 min has elapsed from the beginning of the reaction, the spectrum should be measured. Using software such as MATLAB, where previously the optimal PLS models have been built, a function could be developed allowing the automatic prediction of the concentrations. This function should perform the corresponding pre-treatment of the spectra for each analyte and then put these spectra into the PLS models to predict the concentrations. A paper in which an automated sequential injection for the determination of additives in a nickel electroplating bath is used can be found in the literature [60]. Knowing the composition of the bath can be of additional benefit to the coating industry in terms of reuse, recycling, or cast aside when it is no longer optimal for use, for example because the phosphite concentration exceeds the maximum tolerable.
The method developed in this work has been compared with other methods developed for the analysis of the hypophosphite and phosphite individually or simultaneously in Ni—P electroless baths. Table 4 shows a comparison between these methods, indicating the precision, the time required, and the sample volume needed in the cases in which it has been possible to obtain this information.
Table 4. Comparison table of analytical methods for individual or simultaneous hypophosphite and phosphite determination in Ni—P electroless baths.
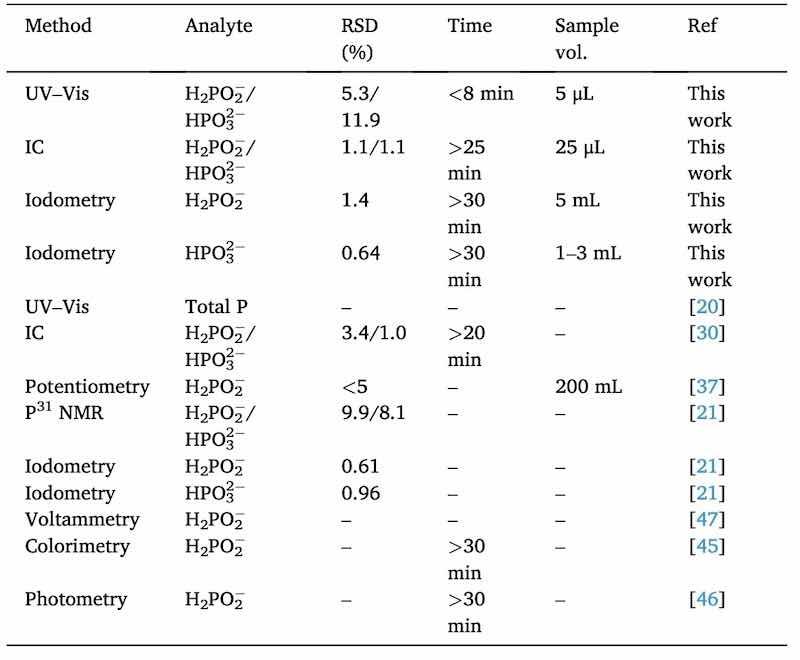
As can be seen in the table, although the developed method offers a higher precision error in the phosphite determination compared to some others, it has a major advantage in that it allows the analysis of both anions at the same time. In the case of iodometric titrations, the determination has to be individual. Many other methods can only be used to determine hypophosphite and only the IC can carry out simultaneous determination. In terms of time and sample consuming, our UV–Vis method is by far the one that shows the lowest values.
Comparing the three methods that have been employed in this work, the simplicity of the UV–Vis method is another advantage compared to IC and titrations. For IC special cares should be taken into account, such as the sample filtration with special cartridges to remove cations. To perform titrations, on the other hand, large amounts of reagents are needed and the quantification of the two analytes must be done separately. Our UV–Vis method only requires a dilution of the sample, and the addition of the reagents is made directly in the cuvette, allowing the simultaneous measurement of both analytes.
4. Conclusions
The molybdenum blue reaction, under some specific conditions, has been proven to be an alternative to the classical titration methods to quantify and control hypophosphite and phosphite simultaneously in nickel electroless baths.
- Even though hypophosphite is the one that gives the blue complex with the molybdenum, the presence of phosphite alteres the spectral signal of the complex. With PLS models both analytes can be determined with low errors and good precision values.
- Good linear ranges and low LOD have been obtained for the two analytes for application in Ni—P baths. Although the LOD for phosphite is higher than the one of hypophosphite, this should not be a serious disadvantage since phosphite becomes a problem in this kind of bath only when its concentration is much higher than the LOD.
- No significant differences were found in the determination of either analyte between the developed method and the reference IC technique.
- The colorimetric method offers certain advantages over the reference techniques (titration and IC) regarding time- and sample-saving, and in terms of simplicity. Any compound that may be present in the samples should not interfere due to the large dilution carried out in the cuvette (1 to 520), making this method versatile and capable of determining both anions in different types of baths, as long as hypophosphite is used as the reducing agent.
Authored by Gorka Albizu, Miren Ostra, Ane Bordagaray, Rosa Garcia-Arrona, and Maider Vidal; Department of Applied Chemistry, Faculty of Chemistry, University of the Basque Country (UPV/EHU), 20018 San Sebastian, Spain
CRediT authorship contribution statement: Gorka Albizu: Conceptualization, Investigation, Software, Validation, Writing – original draft. Miren Ostra: Funding acquisition, Methodology, Supervision, Writing – review & editing. Ane Bordagaray: Writing – review & editing. Rosa Garcia-Arrona: Writing – review & editing. Maider Vidal: Methodology, Supervision, Visualization, Writing – original draft.
Declaration of competing interest: The author(s) declared no potential competing interest with respect to the research, authorship, and/or publication of this article.
Acknowledgements: The authors would like to thank CIDETEC (San Sebastian, Spain) for the helpful advice provided during the experimental part of this work.
Funding: This work was supported by the University of the Basque Country (Project GIU 19/13 and scholar fellowship for Gorka Albizu PIF 18/282), the Basque Government (IT1662-22 and ELKARTEK 20/01) and the Gipuzkoa Provincial Council (2022-CIEN-00006-01).
Data availability: Data will be made available on request.
References
[1] A. Malecki, A. Micek-Ilnicka, Electroless nickel plating from acid bath, Surf. Coat. Technol. 123 (2000) 72–77, https://doi.org/10.1016/S0257-8972(99)00423-5.
[2] V.B. Chintada, R. Koona, M.V.A. Raju Bahubalendruni, State of art review on nickel-based electroless coatings and materials, J. Bio-Tribo-Corrosion 7 (2021) 1–14, https://doi.org/10.1007/s40735-021-00568-7.
[3] R. Parkinson, Properties and Applications of Electroless Nickel, Nickel Dev Inst Publ, 1997.
[4] J.N. Balaraju, T.S.N. Sankara Narayanan, S.K. Seshadri, Electroless Ni–P composite coatings, J. Appl. Electrochem. 33 (2003) 807–816, https://doi.org/10.1023/A: 1025572410205.
[5] M. Yan, H.G. Ying, T.Y. Ma, Improved microhardness and wear resistance of the as- deposited electroless Ni-P coating, Surf. Coat. Technol. 202 (2008) 5909–5913, https://doi.org/10.1016/j.surfcoat.2008.06.180.
[6] G.O. Mallory, The electroless nickel plating bath: effect of variables on the process, in: O. G., J.B. Hajdu (Eds.), Electroless Plating: Fundamentals and Applications, American Electroplaters and Surface Fin, 1990, pp. 57–101.
[7] B. Boipai, T. Banerjee, Study on adhesion failure of electrically conducting electroless Ni-P coating on polyethylene terephthalate substrate, Mater Today Proc. 66 (2022) 3930–3934, https://doi.org/10.1016/j.matpr.2022.07.288.
[8] W. Wang, S. Ji, I. Lee, A facile method of nickel electroless deposition on various neutral hydrophobic polymer surfaces, Appl. Surf. Sci. 283 (2013) 309–320, https://doi.org/10.1016/j.apsusc.2013.06.108.
[9] A. Stankiewicz, I. Szczygieł, B. Szczygieł, Summary of existing models of the Ni-P coating electroless deposition process, Int. J. Chem. Kinet. 45 (2013) 755–762, https://doi.org/10.1002/kin.20810.
[10] J.I. Martins, M.C. Nunes, On the kinetics of copper electroless plating with hypophosphite reductant, Surf. Eng. 32 (2015) 363–371, https://doi.org/10.1179/ 1743 294415Y.0000000066.
[11] I.R. Mafi, C. Dehghanian, Comparison of the coating properties and corrosion rates in electroless Ni-P/PTFE composites prepared by different types of surfactants, Appl. Surf. Sci. 257 (2011) 8653–8658, https://doi.org/10.1016/j.apsusc.2011. 05.043.
[12] W. Sade, R.T. Proença, T.D.de O. Moura, J.R.T. Branco, Electroless Ni-P coatings: preparation and evaluation of fracture toughness and scratch hardness, ISRN Mater. Sci. 2011 (2011) 1–6, https://doi.org/10.5402/2011/693046.
[13] M. Buchtík, P. Kos´ ar, J. Wasserbauer, J. Tkacz, P. Doleˇ zal, Characterization of electroless Ni-P coating prepared on a wrought ZE10 magnesium alloy, Coatings 8 (2018) 1–14, https://doi.org/10.3390/coatings8030096.
[14] V. Genova, L. Paglia, G. Pulci, G. Pedrizzetti, A. Pranzetti, M. Romanelli, F., Marra medium and high phosphorous Ni-P coatings obtained via an electroless approach: optimization of solution formulation and characterization of coatings, Coatings 13 (2023) 1490, https://doi.org/10.3390/coatings13091490.
[15] R. Sun, G. Yu, Z. Xie, B. Hu, J. Zhang, X. He, X. Zhang, Influence of hypophosphite on efficiency and coating qualities of electroless Ni-P deposits on magnesium alloy AZ91D, Int. J. Electrochem. Sci. 10 (2015) 7893–7904.
[16] J.D. Lin, C. Te Chou, The influence of phosphorus content on the microstructure and specific capacitance of etched electroless Ni-P coatings, Surf. Coat. Technol. 368 (2019) 126–137, https://doi.org/10.1016/j.surfcoat.2019.04.009.
[17] C.A. Loto, Electroless nickel plating – a review, Silicon 8 (2016) 177–186, https:// doi.org/10.1007/s12633-015-9367-7.
[18] C.L. Li, H.X. Zhao, T. Tsuru, D. Zhou, M. Matsumura, Recovery of spent electroless nickel plating bath by electrodialysis, J. Membr. Sci. 157 (1999) 241–249, https:// doi.org/10.1016/S0376-7388(98)00381-0.
[19] R. Weil, K. Parker, The properties of electroless nickel, in: G.O. Mallory, J.B. Hajdu (Eds.), Electroless Plating: Fundamentals and Applications, American Electroplaters and Surface Fin, 1990, pp. 111–137.
[20] P. Liu, C. Li, X. Liang, G. Lu, J. Xu, X. Dong, W. Zhang, F. Ji, Recovery of high purity ferric phosphate from a spent electroless nickel plating bath, Green Chem. 16 (2014) 1217–1224, https://doi.org/10.1039/c3gc41779d.
[21] N.K. Dirjal, K.A. Holbrook, P.B. Wells, Stoichiometric measurements in nickel- hypophosphite baths for electroless deposition, Anal. Chim. Acta 290 (1994) 287–293, https://doi.org/10.1016/0003-2670(94)80115-0.
[22] P. Liu, C. Li, X. Liang, J. Xu, G. Lu, F. Ji, Advanced oxidation of hypophosphite and phosphite using a UV/H 2O2 process, Environ. Technol. (United Kingdom) 34 (2013) 2231–2239, https://doi.org/10.1080/09593330.2013.765917.
[23] Toledo M Electroplating Guide Automated Sample Analysis Electroplating Guide.
[24] R.T. Jones, E.H. Swift, Iodometric determination of hypophosphorous and phosphorous acids, Anal. Chem. 25 (1953) 1272–1274, https://doi.org/10.1021/ ac60080a042.
[25] J. Rossman, F. Portala, G. Kirner, A. Steinbach, Monitoring of nickel sulfate, hypophosphite and alkalinity in electroless nickel plating baths The Process Lab Analysis. 70771.
[26] Metrohm Thermo. Titr. Application Note No. H-047 Title: Determination of Nickel by EDTA Back-Titration. 1–2.
[27] A. Agarwal, M. Pujari, R. Uppaluri, A. Verma, Efficacy of reducing agent and surfactant contacting pattern on the performance characteristics of nickel electroless plating baths coupled with and without ultrasound, Ultrason. Sonochem. 21 (2014) 1382–1391, https://doi.org/10.1016/jultsonch.2014.01.015.
[28] V.K. Bulasara, H. Thakuria, R. Uppaluri, M.K. Purkait, Effect of process parameters on electroless plating and nickel-ceramic composite membrane characteristics, Desalination 268 (2011) 195–203, https://doi.org/10.1016/j.desal.2010.10.025.
[29] D.S. Ryder, Separation of orthophosphoric, phosphorous and hypophosphorous acids using single-column ion chromatography with conductivity detection,
[30] M. Biesaga, M. Trojanowicz, Phosphorus speciation in nickel plating baths by ion chromatography, J. Chromatogr. A 705 (1995) 390–395, https://doi.org/10.1016/ 0021-9673(95)00303-5.
[31] M.M. McDowell, M.M. Ivey, M.E. Lee, V.V.V.D. Firpo, T.M. Salmassi, C. S. Khachikian, K.L. Foster, Detection of hypophosphite, phosphite, and orthophosphate in natural geothermal water by ion chromatography, J. Chromatogr. A 1039 (2004) 105–111, https://doi.org/10.1016/j.chroma.2003.11.056.
[32] M.C. Mehra, C. Pelletier, Ion chromatographic determination of hypophosphite, phosphite and orthophosphate ions along with chloride, nitrate and sulfate ions using indirect ultraviolet detection, Anal. Sci. 6 (1990) 431–434, https://doi.org/ 10.2116/analsci.6.431.
[33] Y. Xian, X. Guo, X. Hou, L. Wang, Y. Wu, L. Chen, H. Dong, B. Wang, A modified quick, easy, cheap, effective, rugged, and safe cleanup method followed by liquid chromatography-tandem mass spectrometry for the rapid analysis of perchlorate, bromate and hypophosphite in flour, J. Chromatogr. A 1526 (2017) 31–38, https://doi.org/10.1016/j.chroma.2017.10.047.
[34] S.C. Morton, D. Glindemann, X. Wang, X. Niu, M. Edwards, Analysis of reduced phosphorus in samples of environmental interest, Environ. Sci. Technol. 39 (2005) 4369–4376, https://doi.org/10.1021/es0401038.
[35] T. Soga, G.A. Ross, Simultaneous determination of inorganic anions, organic acids and metal cations by capillary electrophoresis, J. Chromatogr. A 834 (1999) 65–71, https://doi.org/10.1016/S0021-9673(98)00692-X.
[36] J. Lu, Y. Feng, Measurement of orthophosphite concentration in electroless nickel plating baths by sodium ion electrodes, Met. Finish. 107 (2009) 23–26, https://doi.org/10.1016/S0026-0576(09)00044-0.
[37] N. Feldstein, T.S. Lancsek, J.A. Amick, Potentiometric analysis of hypophosphite in electroless nickel plating baths, Anal. Chem. 42 (1970) 945–946, https://doi.org/ 10.1021/ac60290a033.
[38] R.A. Barco, D.G. Patil, W. Xu, L. Ke, C.S. Khachikian, G. Hanrahan, T.M. Salmassi, The development of iodide-based methods for batch and on-line determinations of phosphite in aqueous samples, Talanta 69 (2006) 1292–1299, https://doi.org/ 10.1016/j.talanta.2006.02.060.
[39] J.A.G. Neto, H.A. Ito, K. Das Graças Fernandes, M. De Moraes, A.A. Cardoso, Spectrophotometric determination of phosphite in fertilizers in a flow injection system with online sample preparation, Lab. Robot. Autom. 12 (2000) 286–290, https://doi.org/10.1002/1098-2728(2000)12:6286::AID-LRA3 3.0.CO;2-D.
[40] V.M. Gurame, G.S. Gokavi, Kinetics and mechanism of oxidation of hypophosphite by Waugh-type enneamolybdomanganate(IV) in perchloric acid, Polyhedron 27 (2008) 1905–1910, https://doi.org/10.1016/j.poly.2008.02.028.
[41] J.N. Barge, G.S. Gokavi, Oxidation of hypophosphite and phosphite by Anderson- type Hexamolybdocobaltate(III) anion, Int. J. Chem. Kinet. 48 (2016) 106–113, https://doi.org/10.1002/kin.20975.
[42] M.S.P. Rao, A.R.M. Rao, K.V. Ramana, S.R. Sagi, Thallimetric oxidations part VII: titrimetric and spectrophotometric methods for the determination of hypophosphite and ternary mixtures of hypophosphite, phosphite, and oxalate, Can. J. Chem. 71 (1993) 801–808, https://doi.org/10.1139/v93-106.
[43] A.P. Scanzillo, Spectrophotometric determination of sodium hypophosphite as a molybdenum blue complex, Anal. Chem. 26 (1954) 411–412, https://doi.org/ 10.1021/ac600 86a042.
[44] A. Anton, Spectrophotometric determination of hypophosphite in the presence of phosphates, Anal. Chem. 37 (1965) 1422–1423.
[45] G. Gutzeit, Colorimetric Methods of Determining Hypophosphite Contents of Solutions, 1953 (US-2697651-A).
[46] M.C. Lambert, Determination of Hypophosphite Ion Concentration, 1974 (US- 3816075-A).
[47] M. Pavlov, G. Chalyt, P. Bratin, A. Kogan, M. James Perpich, Measurement of the Concentration of a Reducing Agent in an Electroless Plating Bath, 2004 (US- 6709561-B1).
[48] J.H. Golden, H.E. Gotts, J. Jung, B.M. Van Den, Method and System for Analyte Determination in Metal Plating Baths, 2004 (US-20040046121-A1).
[49] A.W. Grobin J, Phosphite Testing Method, 1969 (US-3425805-A).
[50] H. Martens, T. Naes, Multivariate Calibration, 1st ed., 1989 (Chichester).
[51] P. Geladi, B.R. Kowalski, Partial least-squares regression: a tutorial, Anal. Chim. Acta 185 (1986) 1–17, https://doi.org/10.1016/0003-2670(86)80028-9.
[52] D.C. Harris, Quantitative Chemical Analysis, 9th ed., 2016 (New York).
[53] D.M. Haaland, E.V., Thomas, partial least-squares methods for spectral analyses. application to simulated and glass spectral data, Anal. Chem. 60 (1988) 1202–1208, https://doi.org/10.1021/ac00162a021.
[54] D.M. Haaland, E.V. Thomas, Partial least-squares methods for spectral analyses. 1. Relation to other quantitative calibration methods and the extraction of qualitative information, Anal. Chem. 60 (1988) 1193–1202, https://doi.org/10.1021/ ac00162a020.
[55] M.C. Ortiz, L.A. Sarabia, A. Herrero, M.S. S´ anchez, M.B. Sanz, M.E. Rueda, D. Gim´ enez, M.E. Mel´ endez, Capability of detection of an analytical method evaluating false positive and false negative (ISO 11843) with partial least squares, Chemom. Intell. Lab. Syst. 69 (2003) 21–33, https://doi.org/10.1016/S0169-7439 (03)00110-2.
[56] J. Miller, J.C. Miller, Statistics and Chemometrics for Analytical Chemistry, 5th ed., 2018 (Essex).
[57] J. Mandel, F.J. Linning, Study of accuracy in chemical analysis using linear calibration curves, Anal. Chem. 29 (1957) 743–749.
[58] A.G. Gonz´ alez, M.A. Herrador, A.G. Asuero, Intra-laboratory testing of method accuracy from recovery assays, Talanta 48 (1999) 729–736, https://doi.org/ 10.1016/S0039-9140(98)00271-9.
[59] G. L´ opez-Cueto, M. Ostra, C. Ubide, Linear and non-linear multivariate calibration methods for multicomponent kinetic determinations in cases of severe non- linearity, Anal. Chim. Acta 405 (2000) 285–295, https://doi.org/10.1016/S0003- 2670(99) 00709-6.
[60] M. Ostra, C. Ubide, M. Vidal, J. Zuriarrain, Process analytical chemistry in a nickel electroplating bath. Automated sequential injection for additive determination, Anal. Methods 3 (2011) 2726–2732, https://doi.org/10.1039/c1ay05434a.