


Electroplated zinc-nickel (Zn-Ni) coatings are commonly applied as corrosion protection for steel components in demanding industrial environments.
 Marija Lindner, Rowena Duckstein, and Christoph Herrmann.However, due to high process complexity, coupled with a limited process transparency and irregular chemical monitoring, achieving resource efficiency and predictive control remains challenging. This paper presents a data-driven approach for monitoring and modelling of an alkaline Zn-Ni barrel plating process at the process and product levels using machine learning (ML) techniques.
A methodology was developed within a cyber-physical production system framework for training the models based on a controlled laboratory environment (20 L bath volume) and knowledge transfer on an industrial electroplating plant (13,000 L bath volume). Different supervised algorithms were trained with a limited set of input features to predict metal concentrations of the bath, coating thickness, nickel ratio in the coating and aggregated coating quality indicator.
Despite data scarcity and process variability, the selected best models demonstrate accurate prediction rates (>86%). The results show that experimentally generated data can improve product-level modelling in the industrial environment, while process-level transfer remains limited when relevant industrial interventions, such as zinc dosing, are not recorded.
1. Introduction
Electroplated finishes play a vital role in significantly prolonging the lifespan of parts and tools by adding thin metallic layers on their surface to improve corrosion and wear resistance. By increasing component lifetime, electroplating also contributes to waste reduction and resource conservation (Leiden et al., 2020). At the same time, maintaining process stability is challenging, as electroplating systems are characterized by a large number of interacting influencing factors, including electrolyte composition, current density, temperature, and additive concentrations. Even small variations in these parameters can significantly affect coating quality, leading to defects, non-uniform layer thickness, and increased production costs. Against this background, there is growing interest in data-driven modelling approaches that enable predictive monitoring and optimization of electroplating processes.
In recent years, machine learning (ML) methods have increasingly been applied to model electrochemical processes and predict coating properties. Several studies have demonstrated successful prediction of coating thickness, composition, hardness, and defect formation using algorithms such as XGBoost, Random Forest, Support Vector Regression, and k-Nearest Neighbors (Katirci et al., 2021; Oliveira et al., 2025; Sánchez Lasheras et al., 2014; Zhai et al., 2025). In addition, image-based approaches have been developed to automatically classify coating quality based on surface features, including convolutional neural networks and segmentation methods such as Mask R-CNN (Katirci and Danaci, 2023; Katirci and Tekin, 2022; Katırcı et al., 2022). These approaches enable automated visual quality inspection and have been partially integrated into optimization frameworks, for example for controlling additive concentrations and process parameters. Furthermore, advanced optimization strategies such as reinforcement learning and hybrid neuro-fuzzy models have demonstrated the potential to simulate complex electrochemical behaviour and derive optimal operating conditions (Ren et al., 2026; Sun et al., 2024). Overall, these studies highlight the considerable potential of ML-based methods to improve process control and support the development of intelligent electroplating systems.
Despite these advances, a key limitation of many existing studies lies in the selection of input variables, which often do not reflect industrial practice. Numerous investigations rely on laboratory-scale datasets, highly controlled experimental conditions, or input features that are difficult to measure reliably in production environments, such as detailed additive concentrations, microstructural descriptors, or image-based surface features obtained under specialized optical conditions (Katırcı et al., 2022; Ren et al., 2026; Sun et al., 2024). In industrial electroplating plants, however, process monitoring is typically based on continuously recorded equipment data, such as current density, voltage, temperature, and flow conditions, as well as metal ion concentrations in the bath. This discrepancy between experimentally available variables and industrially measurable process data represents a major barrier to transferring ML-based modelling approaches into real manufacturing environments. In addition, limited data availability under production conditions further restricts the application of many ML approaches, as data acquisition costs, process interruptions, and variability between production lines hinder the creation of large, standardized datasets. Models developed under laboratory conditions therefore often require extensive adaptation before they can be deployed in industrial systems, where disturbances, equipment aging, and process variability introduce additional complexity.
Against this background, the present work develops ML models for an alkaline Zn-Ni barrel plating process using only input variables that are routinely available in industrial electroplating operations. The study distinguishes between two modelling scenarios: process-level modelling of Zn and Ni concentrations in the electrolyte after coating, and product-level modelling of coating thickness, nickel ratio in the coating, and a binary coating quality indicator. A controlled 20 L test environment was used to generate systematic parameter variations and deliberately broaden the represented process window, while an industrial 13,000 L environment provided production data under realistic operating conditions. The central objective is to evaluate which modelling targets can benefit from knowledge transfer between both environments and where transferability is limited by unrecorded industrial process interventions. Overall, the proposed modelling framework is consistently based on industrially available process and material data, ensuring direct compatibility with existing monitoring systems. The study is therefore characterized by its strict alignment with industrial constraints, the simultaneous consideration of product- and process-level predictions, and the deliberate enhancement of model robustness through enriched datasets. It contributes to bridging the gap between laboratory-scale research and industrial application and supports the development of intelligent, data-driven manufacturing systems with improved process transparency, higher resource efficiency, and reduced environmental impact.
The paper is structured as follows. Section 2 reviews ML applications in electroplating and identifies the research gap. Section 3 introduces the CPPS-based methodological framework, the physical Zn-Ni electroplating systems, data acquisition, target variables, and modelling scenarios. Section 4 presents modelling results in the test environment. Section 5 evaluates knowledge transfer and industrial transferability. Section 6 concludes the paper and outlines future work.
2. State of research
Fig. 1 summarizes recent ML applications in electroplating from 2014 to 2026. Most studies are based on bench-scale experiments, typically using Hull cells, beaker-based setups, or cuvette-type configurations with virgin, self-prepared electrolytes. Consequently, industrial constraints such as commercial electrolyte chemistry, bath ageing, chemical consumption, and production-related variability are rarely represented. In addition, only a few studies discuss whether the identified model relationships are physically plausible.
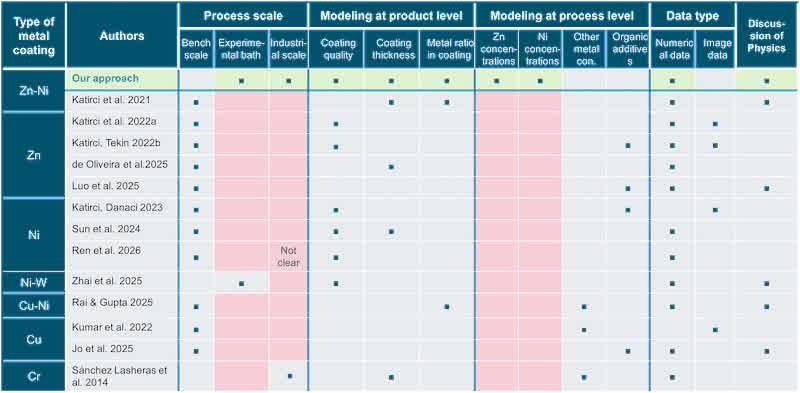
Fig. 1. State of the art of ML modelling in electroplating classified by process scale, modelling target, data type, and discussion of physics.
2.1. Modelling at product level
Regarding modelling at product level, some studies focus on coating quality and defect prediction, often using image-based data. For zinc coating, Katirci et al. used Random Forest models to predict coating brightness from Hull cell experiments and reported high classification performance (Katırcı et al., 2022). Similarly, Katirci and Tekin modelled zinc bath states through image-based classification of coating outcomes, again in a Hull cell setup (Katirci and Tekin, 2022). For nickel systems, Katirci and Danaci combined Mask-R-CNN and Random Forest models to classify surface quality and infer additive requirements from Hull cell experiments (Katirci and Danaci, 2023). Sun et al. modelled coating defects and colour in black nickel electroplating using machine learning methods in a beaker-based setup (Sun et al., 2024). These studies demonstrate strong predictive performance for quality-related targets, but they are largely restricted to small-scale experimental systems and frequently rely on image-based rather than process integrated numerical data. Ren et al. modelled defect-related coating quality in black nickel electroplating by combining lightness and uniformity into a pass/fail target, alongside plating rate as a continuous output, and used the resulting virtual process model for reinforcement-learning-based current-density optimization (Ren et al., 2026).
A second group of studies addresses coating thickness prediction. Katirci et al. predicted Zn-Ni coating thickness in Hull cell experiments using machine learning models trained on electrolyte composition data (Katirci et al., 2021). De Oliveira et al. predicted zinc coating thickness using XGBoost based on experimental Hull cell data and reported high predictive accuracy (Oliveira et al., 2025). Sánchez Lasheras et al. developed an evolutionary support vector machine approach for hard chromium thickness prediction and included selected pre-treatment and bath related parameters as model inputs (Sánchez Lasheras et al., 2014). Although these studies show that coating thickness can be modelled effectively, most are still based on controlled laboratory conditions and do not systematically address industrial scale transferability.
A third group of articles has a focus on prediction of metal composition in coating (metal ratio), which is more closely related to the present study. Katirci et al. additionally to coating thickness predicted also nickel ratio in the deposited layer and identified key electrolyte components affecting the response variables (Katirci et al., 2021). Rai and Gupta modelled process-dependent responses in Cu-Zn alloy deposition, including alloy composition related effects, using ANN, RSM, and ANFIS approaches (Rai and Gupta, 2025). However, studies explicitly addressing alloy composition remain limited, and only one identified work specifically focuses on a Zn-Ni electroplating bath.
2.2. Modelling at process level
In regard to modelling of bath composition, several studies focus either on metal or additive concentrations in a bath. However, most of this work addresses organic additives or indirect descriptors of electrolyte performance rather than the concentrations of the main metallic elements under industrially relevant conditions. For zinc electroplating, Katirci and Tekin investigated additive-related bath states using image-based classification in a Hull cell setup (Katirci and Tekin, 2022). In nickel electroplating, Katirci and Danaci combined surface quality classification with Random-Forest-based prediction of bath composition and subsequent additive optimization (Katirci and Danaci, 2023). Luo et al. predicted Gutmann donor numbers of electrolyte additives from molecular descriptors and linked them to the electrochemical performance of zinc anodes (Luo et al., 2025). Zhai et al. analyzed Ni-W alloy deposition and identified bath chemistry related variables and process parameters influencing coating hardness (Zhai et al., 2025). Jo et al. focused on Cu bath monitoring and trained ANN models on voltammetric profiles to quantify the organic additive concentrations of DPS and PEG-PPG (Jo et al., 2025). Kumar et al. used convolutional LSTM models to predict the future image-based morphology of dendritic Cu electrodeposition from real-time image sequences rather than bath composition (Kumar et al., 2022).
These studies highlight the relevance of electrolyte composition for process behaviour, but they also show that previous machine learning approaches have mainly focused on additives and secondary bath descriptors. In contrast, the direct modelling of Zn and Ni concentrations in electroplating baths remains insufficiently addressed.
Taken together, the presented studies demonstrate that machine learning can successfully model several electroplating targets, particularly coating quality, thickness, and additive related bath behaviour. At the same time, three major gaps remain. First, most studies are conducted at bench scale and therefore only partially represent industrial process conditions. Second, the majority rely on virgin or simplified electrolytes rather than aged commercial baths under production load. Third, no identified study models metal bath concentrations together with coating related targets across both test and industrial environments. This is where the present work contributes by developing and comparing process-level and product-level black-box models for Zn-Ni electroplating across a controlled test environment and an industrial-scale production environment.
3. Materials and methods
This study evaluates the transferability of ML models between a controlled test environment and an industrial Zn-Ni electroplating environment. The methodological approach is organised according to a cyber-physical production system (CPPS), consisting of four elements: physical system, data acquisition, cyber system, and decision support/control (Thiede et al., 2016). The proposed framework to structure the CPPS builds on previous work (Lindner et al., 2025), and includes two physical systems, a test environment (a) and an industrial environment (b) (Fig. 2). Within this framework, the test environment is used for systematic parameter variation and targeted generation of different coating results, whereas the industrial environment provides realistic production data under normal operating conditions.
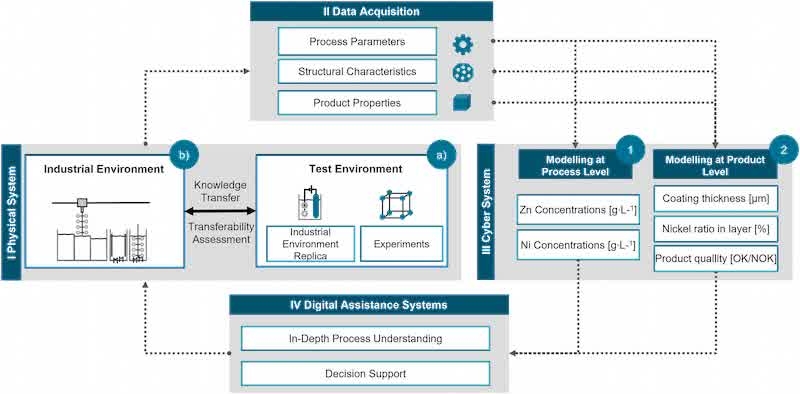
Fig. 2. Framework of the cyber-physical production system (CPPS), including knowledge transfer and transferability assessment between the test and industrial environment (adapted from (Lindner et al., 2025)).
The methodological approach distinguishes between two modelling scenarios. Scenario 1 refers to process-level modelling and targets Zn and Ni concentrations in the electrolyte after the coating process. Scenario 2 refers to product-level modelling and targets coating thickness, nickel ratio in the coating, and coating quality. Depending on the modelling objective and the available data, either one of these scenarios or both can be implemented.
3.1. Physical system: Zn-Ni barrel electroplating process
An electroplating process chain for alkaline zinc-nickel coatings on workpieces such as steel caps using barrel plating technology is investigated. Barrel plating is a widely used electroplating technique for processing small parts such as screws, nuts, washers, and other fasteners in large quantities. The process is efficient, cost-effective, and particularly suited for achieving uniform coatings on small, irregularly shaped components. The components to be coated are filled into a barrel. The barrel is continuously rotated and immersed in the active and rinsing baths of the entire process chain. The process begins with a pre-treatment consisting of a hot degreasing with 60 g L−1 potassium hydroxide (KOH) at 60 °C and then a pickling with 15 - 20% concentrated hydrochloric acid (HCl) to remove heavy contamination from oils and rust. Afterwards, electrolytic degreasing (cathodic) with 120 g∙L−1 KOH at 40 °C, takes place, whereby the gaseous hydrogen formed on the component surface is released and fine impurities, including those in pores, are detached. This is followed by a mild pickling with 3-5% HCl, in which residues of KOH solution are neutralized and a newly formed thin oxide coating is removed. In the coating phase, the barrel with workpieces is placed in an alkaline zinc-nickel electrolyte of type SLOTOLOY ZN 210 VX from company Dr.-Ing. Max Schlötter GmbH & Co. KG. The electrolyte contains zinc and nickel salts, sodium hydroxide (NaOH) as conductive salt as well as a complexing agent and brighteners, see Table 1.
Table 1. Composition of zinc-nickel electrolyte ZN 210 VX according to manufacturer specifications.
| Component | Function | Concentration |
| Zinc | Metal ion | 6.5-8.5 |
| Nickel | Metal ion | 0.9-1.2 |
| NaOH | Conductive Salt | 110-130 |
| Slotoloy ZN 211 | Complexing Agent | 90-140 |
| Slotoloy ZN 212 | Leveler | 25-40 |
| Slotoloy ZN 214 | Brightener | 0.5-2 |
| Slotoloy ZN 216 VX | Top brightener | 0.1-0.3 |
Manufacturers do not disclose the exact additive composition. Typically, alkaline Zn-Ni electrolytes contain complexing agents, brighteners, levelers, wetting agents, and buffers, which influence metal ion stabilization, grain refinement, layer homogeneity, gas bubble formation, and pH stability (Jeon et al., 2023; Lotfi et al., 2018; Praveen and Venkatesha, 2012; Son et al., 2023; Zaky et al., 2011). Since these additive concentrations are not routinely available in the industrial environment, they were not included as model inputs. This reflects a typical limitation of industrial electroplating data. Furthermore, manufacturers use additive packages containing several substances in order to exploit their synergistic effects.
An electric current facilitates the deposition of a uniform Zn-Ni alloy coating, known for its excellent corrosion resistance and ductility. The rotation of the barrel ensures uniform exposure and prevents clumping of caps, promoting consistent coating thickness. Post-treatment includes passivation based on a chromium (III) conversion bath using the transparent coating Slotopas ZN-T-80 from Dr.-Ing. Max Schlötter GmbH & Co. KG to improve corrosion resistance. Conversion coatings are very thin coatings on a metal surface, which are usually produced by the chemical reaction of an aqueous treatment solution with the metallic substrate. This step is followed by drying and curing to further improve the coating's durability and performance.
Typical operating parameters and target ranges specified for the Zn-Ni electrolyte are summarized in Table 2.
Table 2. Operating parameter range of zinc-nickel electrolyte ZN 210 VX according to manufacturer specifications.
| Parameter | Type | Range |
| Temperature [°C] | Process Parameter | 30 ± 2 |
| Cathodic current density [A∙dm−2] | 0.5-1.0 | |
| Deposition rate at 1 A dm−2 [μm∙min−1] | 0.16-0.22 | |
| Coating time [min] | 80 | |
| Nickel ratio in coating [%] | Structural Characteristic | 12-16 |
| Coating thickness [μm] | 8-12 |
3.1.1. Test and industrial environments
Data was obtained, on the one hand from a test environment with a manual electroplating system with a 20 L bath volume and on the other hand from an industrial environment with an automatic system with 13,000 L bath volume. Both environments fulfil different functions in data acquisition. The industrial environment provides a large amount of practical data. However, due to ongoing production, process parameters can only be varied to a limited extent. In the test environment, high throughput cannot be achieved, but the variation possibilities are almost unlimited. In this environment, for example, reject parts can also be generated in order to examine the limits of the process more specifically.
To best compare the two environments and the data generated there, the industrial process was evaluated by thorough inspections of the electroplating plant, in-depth interviews, available industrial data and then replicated in the test environment, as far as feasible, taking into account the given scaling differences. This includes the same sequence of individual process steps, the use of the same process parameters as well as the chemicals and anode material (“VX 1 special anode” which should reduce the formation of cyanide and degradation processes). The same product, see Fig. 3, was also coated in a smaller version (1 cm vs. 3 cm in diameter).
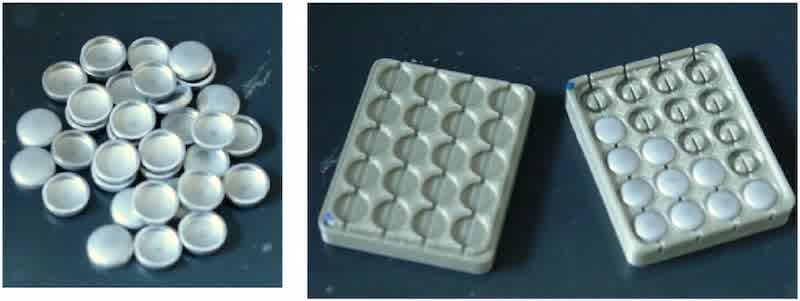
Fig. 3. (left) Photo of the caps that were defined in the study as the product to be coated. (right) Photo of the holder for 20 caps each for the XRF measurements on the top and bottom of the cap.
The main differences, apart from the different scaling and the automatic vs. manual electroplating, are on the one hand in the provision of the zinc salt: in the industrial environment there is an additional zinc dissolving station with soluble zinc anodes. This station supplies a total of nine electrolyte baths with zinc. The amount of dissolved zinc is determined by raising and lowering the anode rails. In the test environment only one electrolyte bath is used and the zinc salt is added via a metal salt solution due to the significantly lower throughput. Furthermore, two baths are used in the industrial plant for pickling and hot degreasing, as many different products with varying degrees of contamination are used in production, whereas only the caps are coated in the test environment. The first bath initially removes the majority of the contamination and the second bath ensures the required cleaning quality.
3.1.2. Target variables and parameter selection
To enable knowledge transfer from the test environment to the industrial environment, it is essential that the parameters required for monitoring are already established and routinely collected in a typical industrial electroplating plant. Therefore, only typical electroplating process parameters, structural characteristics and product properties were considered in the proposed approach: i) coating time, current density, temperature, and zinc and nickel concentrations, ii) coating thickness and nickel ratio in coating, and iii) corrosion protection (Fig. 4).
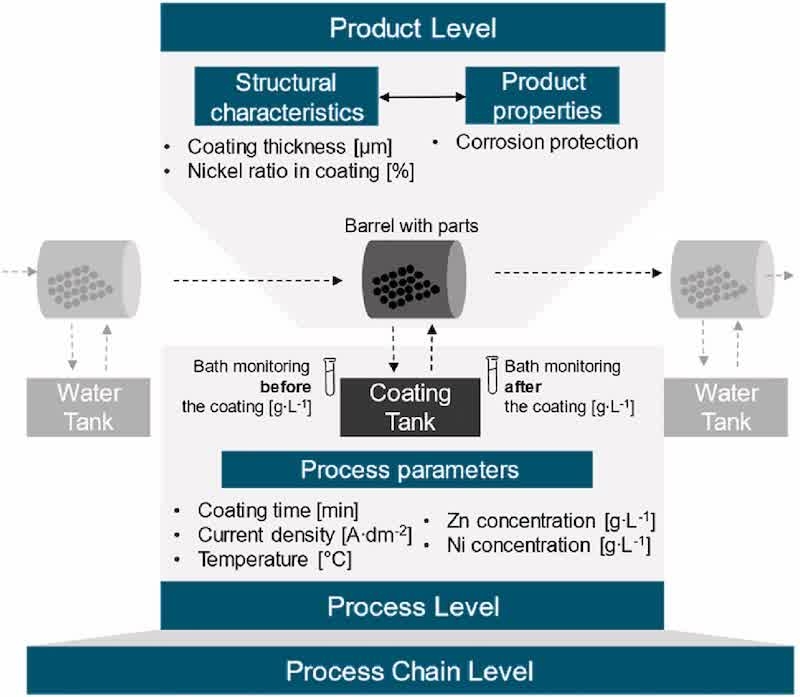
Fig. 4. Multi-level modelling approach at the process and product levels, depicting process-product-interdependencies between process parameters, structural characteristics and product properties.
The purpose of the galvanic Zn-Ni coating is to provide corrosion protection for the components. According to the literature, this is expected when the coating has a nickel ratio between 10 and 18 at.% due to the formation of a γ-phase, which has high corrosion resistance, hardness, and strength (Burliaev et al., 2021). This is also specified in various standards (DIN 50979; ASTM B841; DIN EN ISO 4526), which also define a permissible lower coating thickness range of 8 to 15 μm. Both the nickel ratio and the coating thickness were the target values, whose specified ranges had to be met with the respective parameter variations.
The current density was varied because, among others, it determines the deposition rate of the coating and that of the alloy components, and thus the composition of the coating. In addition to kinetics and mass transport, the temperature influences the conductivity of the electrolyte and affects the consumption of electrolyte additives. The additives are cathodically reduced and compete with metal deposition. As the temperature rises, their consumption increases disproportionately, which in turn also influences the layer properties (Kanani, 2020). Since the Zn-Ni bath heats up during production, it was necessary to clarify how warm the bath could become in order to continue to meet the target ranges. Also, the Zn and Ni concentrations and the coating time were varied, as these directly influence the coating composition and coating thickness.
3.2. Data acquisition
During the data acquisition phase (II) datasets are collected from both systems (Fig. 2). The sampling frequency corresponds to one observation per coating process. Consequently, the time resolution is limited to the process level, since an individual coating process over time is typically not being recorded in an industrial practice, even though higher sampling frequencies on the order of seconds would be technically feasible.
In addition to the coating process implementation, the bath and coating analysis were also coordinated between the two environments. In both environments, zinc and nickel concentrations were sampled before and after the coating process. In the test environment the sampling was done manually and analyzed with an X-ray fluorescence (XRF) spectrometer in an in-house analysis laboratory. To measure the Zn and Ni bath concentrations, a bath sample was taken and measured a total of five times. An average value was then calculated from these measured values. In comparison, in the industrial environment, automatic sampling and concentration determination were performed every 15 min on the plant using an online XRF spectrometer. At an element specific crystal and detector angle, the device records the metal characteristic fluorescence in counts per second. For each angle, at least three replicate measurements are taken, outliers are checked and repeated if necessary, and the final value is the mean of the accepted measurements which is then converted to concentration using a prior calibration curve.
The coating thickness and composition were measured after every coating process in both environments using XRF analysis in an in-house laboratory. For this purpose, a holder was designed and manufactured using additive manufacturing. The holder enables a reproducible examination of the top and bottom of 20 caps per batch, see Fig. 3. Both parts of the holder can be plugged together so that the top and bottom of the caps can be aligned with defined positioning by turning the top and bottom of the holder without manual repositioning.
3.2.1. Test environment dataset
This section focuses on the data processing from the test environment and, in particular, of data generated during the coating process. The following parameters were varied extensively:
- Current density (0.4 – 0.8 A dm−2)
- Temperature (20 – 42 °C)
- Zn concentration (4 – 6 g L−1)
- Ni concentration (0.5 – 1.5 g L−1)
- Barrel speed (3.5 – 6 rpm)
- Coating time (65 – 80 min)
All other pre- and post-treatment process steps were carried out with the same parameter settings. This data is not considered in this approach. For each experiment conducted in the test environment, 20 caps were manually sampled by the operator. The coating thickness and composition were measured on both the top and bottom sides of each cap, resulting in a total of 40 measurements per experiment. The mean of all measurements was then calculated and used for further analysis as “Mean Coating Thickness” and “Mean Nickel Ratio” respectively. Current density and temperature are automatically set parameters, whereas the coating time was set manually by the operator by removing the barrel from the electroplating bath after 80 min.
A total of 186 experiments were conducted, whereas experiments affected by missing values or invalid data were excluded, and therefore are not part of this final dataset (Fig. 5). In 18 experiments the standard process parameters were tested as initial data. In further 57 experiments the temperature and in 40 experiments the current density was varied. On the one hand, variations in current density were combined with changes in zinc concentration and nickel concentration in 15 experiments in each case. On the other hand, exclusively metal concentrations were varied (zinc in 11 experiments; nickel in 12 experiments). Furthermore, 9 experiments were carried out with different barrel speeds, while in a further 9 experiments the barrel speed and the coating time were varied simultaneously. The experimental data was acquired within the period of 12 months.
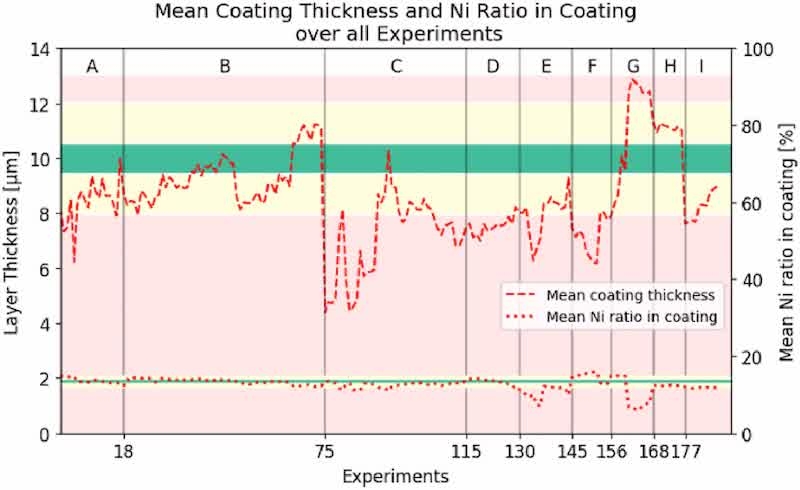
Fig. 5. Mean coating thickness and nickel ratio in coating over different experiments: A: initiation of the process; B: variation of temperature; C: variation of current density; D: variation of both current density and zinc concentration; E: variation of both current density and nickel concentration; F: zinc variation; G: nickel variation; H: variation of barrel speed; I: variation of barrel speed and coating time.
Fig. 5 depicts the target variables mean coating thickness [μm] and Ni ratio in coating [%], together with their corresponding quality areas. The optimal coating thickness lies within the range [9.5-10.5 μm]. The lower tolerance limit for an acceptable part is set within the range of [8-9.5 μm], while the upper tolerance limit falls between [10.5-12 μm]. Coating thicknesses below 8 μm or above 12 μm are classified as reject parts. The optimal Ni ratio in coating is identified between 13 and 14%, whereas coatings with Ni contents below 12% and above 15% are considered outside the tolerable range required for ensuring corrosion protection. The experiments were intentionally designed to create a broader range of coating qualities in order to obtain a more varied dataset for model development and evaluation.
The optimal zinc concentration in Fig. 6a) lies between 6.5 and 8.5 [g∙L−1]. As one of the objectives was to reduce the overall resource consumption, the zinc concentrations were set lower than the optimal with the aim of investigating the feasibility of lower dosing corridors and to take into account the coating quality standards. The optimal nickel concentrations are defined between 0.75 and 1.5 [g∙L−1] (Fig. 6b).
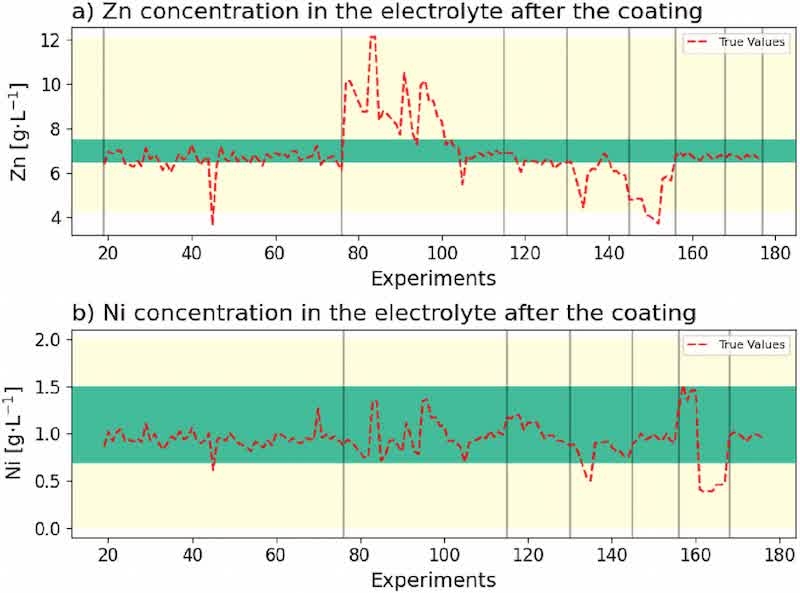
Fig. 6. Experimentally measured Zn and Ni concentrations in the electrolyte after coating.
3.2.2. Industrial environment dataset
Similarly to the test data, the industrial data was gathered over several weeks during normal coating operations, resulting in a dataset of 151 coating batches across 43 different parts. The variables “Mean Coating Thickness” and “Mean Nickel Ratio” were both assessed as a mean value of multiple measurements after a coating process in an in-house laboratory via X-ray. Five repeated measurements were performed at each of three distinct locations on the parts, namely the top, bottom, and side, resulting in 15 measurements for each coating batch. Current density, coating time and temperature were automatically set in the plant control system, whereas as already described, the zinc and nickel concentrations were automatically sampled before and after the coating by an online XRF spectrometer.
3.3. Cyber system: modelling scenarios
Further, the datasets are modelled within the third element (Fig. 2, III Cyber System), addressing two primary scenarios:
- Modelling at the process level of process parameters, focusing on the aspects relevant for the maintenance of the tank electrolyte, especially on Zn and Ni concentrations in the electrolyte after the coating process.
- Modelling at the product level, specifically focusing on structural characteristics coating thickness and nickel ratio in coating, as well as product properties based upon labelled coating thickness, and corrosion protection. Corrosion protection is derived from defined required properties of the coating thickness and the nickel ratio in the coating (further referred to as coating quality).
Process parameters serve as input features at both the product and process levels. Metal concentrations are modelled using input samples collected prior to the coating process, with the target values corresponding to the concentrations obtained after the coating process.
Different algorithms have been applied and compared, including Random Forest, Support Vector Regression, Multi-Layer Perceptron (MLP), Linear Regression, XGBoost, Gaussian Process Regression (GPR) and 1D-CNN (Breiman, 2001; Chen and Guestrin, 2016; Ding et al., 2021; Ige and Sibiya, 2024; LeCun et al., 2015; Rasmussen, 2006). Additionally, in regression models, a GPR approximation with 95% confidence band was added to address prediction uncertainty. All models used an 80/20 data-split, and a random_state was used by starting the random split always from the same seed and producing the identical random sequence to ensure reproducible results across different algorithms. Additionally, stratified sampling was applied in most models, in order to include the data from all experiments in the training dataset. Furthermore, the application of synthetic data was additionally investigated to improve modelling performance. Since no significant performance gains were achieved, this approach was discontinued and is not examined further in this study.
3.4. Digital assistance and decision support
The fourth element of the framework (Fig. 2, IV Digital Assistance Systems), closes the loop by providing deeper process understanding and decision support for the worker. The test environment loop of the CPPS serves as the foundation for knowledge discovery and transfer, as experimental investigations involving systematic variation of process parameters are only feasible in controlled testing environments. The knowledge discovery includes the modelling pipelines for different target variables in the Cyber System, as well as the selection of suitable algorithms for the respective task. Furthermore, deploying the models in the industrial environment enables monitoring at both the process and product-levels, thereby providing decision support.
4. Modelling results in test environment
This section presents the modelling results obtained in the test environment for Scenario 1a and Scenario 2a. The aim is to evaluate whether process-level and product-level targets can be predicted under controlled but industrially inspired experimental conditions.
4.1. Scenario 1a: modelling at process level in test environment
To model the post-coating metal concentrations in the Zn-Ni tank, following input parameters are used:
- Coating time [min],
- Temperature [°C],
- Current density [A∙dm−2],
- Zinc concentration before the coating [g∙L−1]
- Nickel concentration before the coating [g∙L−1].
The typical duration of a coating process is 80 min. It should be noted that in this case the models performed better without the data with a simultaneous parameter variation of barrel speed and the coating time (Fig. 5, area I), so the final dataset contained 177 experiments.
4.1.1. Zinc concentration after the coating [g∙L−1]
For modelling the Zn concentration, different regression algorithms were applied and quantitatively compared via R2 and MAE (Fig. 7a). The Random Forest model achieves the highest predictive performance with an R2 = 87% and lowest MAE = 0.28 g L−1 indicating a generalization capability. Following, Linear Regression and Gaussian Process algorithms also indicate a high performance, outperforming several other nonlinear models (MLP, SVR and 1D-CNN). Furthermore, Fig. 7b shows the predicted Zn concentration after the coating on test data and demonstrates that this model is able to closely follow the overall level and the local trends, including regions with varying Zn concentration across most experiments. Additionally, the approximate 95% predictive interval from the GPR model gives an overview of the predictive uncertainty, with a mixed-length-scale kernel for capturing multi scale behaviour. The width of the uncertainty band is mostly constant and it quantifies the confidence envelope of the model, meaning that the model is robust in most regions. The parity plot in Fig. 7c compares the predicted Zn concentrations with the measured ground truth concentrations. Most predictions are located around the ideal line with minor deviations. The deviations can be attributed to a smaller data density and increased experimental variability in these regions. Overall, the ensemble-based ML models provide accurate predictions of Zn concentrations after the coating.
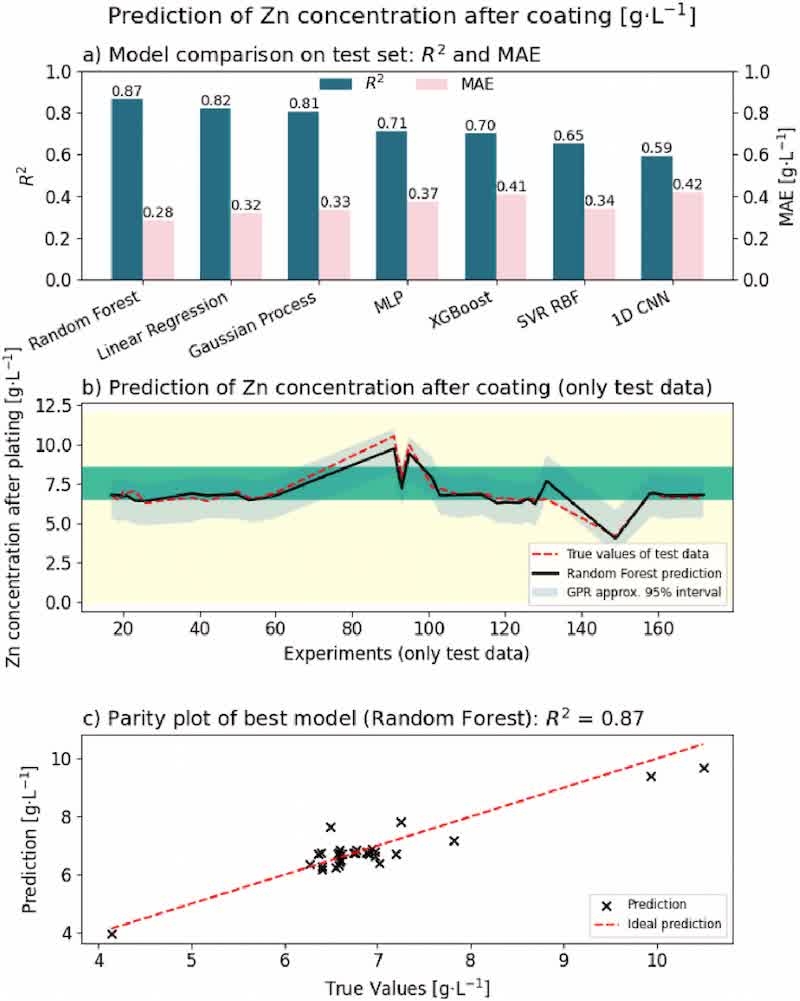
Fig. 7. Comparison of different algorithms for predicting the concentration of Zn in the electrolyte after coating.
4.1.2. Nickel concentration after the coating [g∙L−1]
The results for Ni concentration prediction show a strong and consistent model performance across most algorithms with multiple R2 values above 80% (Fig. 8a). The Linear Regression model achieves the highest score on the test dataset with an R2 = 91%, and the lowest MAE of 0.04 g L−1. Since the target variable lies in the range of 0.5 to 1.5 g L−1, the low MAE indicates a high level of predictive precision of the model. Furthermore, as depicted in Fig. 8b, the predictions of Linear Regression are closely following the true values, suggesting that the relationship between the process parameters and the Ni concentration is predominantly linear within this process window. The GPR based approx. predictive interval (Fig. 8b) remains narrow and mostly stable over the test data range, indicating a high level of confidence, and limited epistemic uncertainty which normally occurs with limited or unbalanced datasets. The last plot (Fig. 8c) provides additional analysis of the best model with a parity plot, where model predictions are scattered tightly around the ideal predictions with no visible outliers.
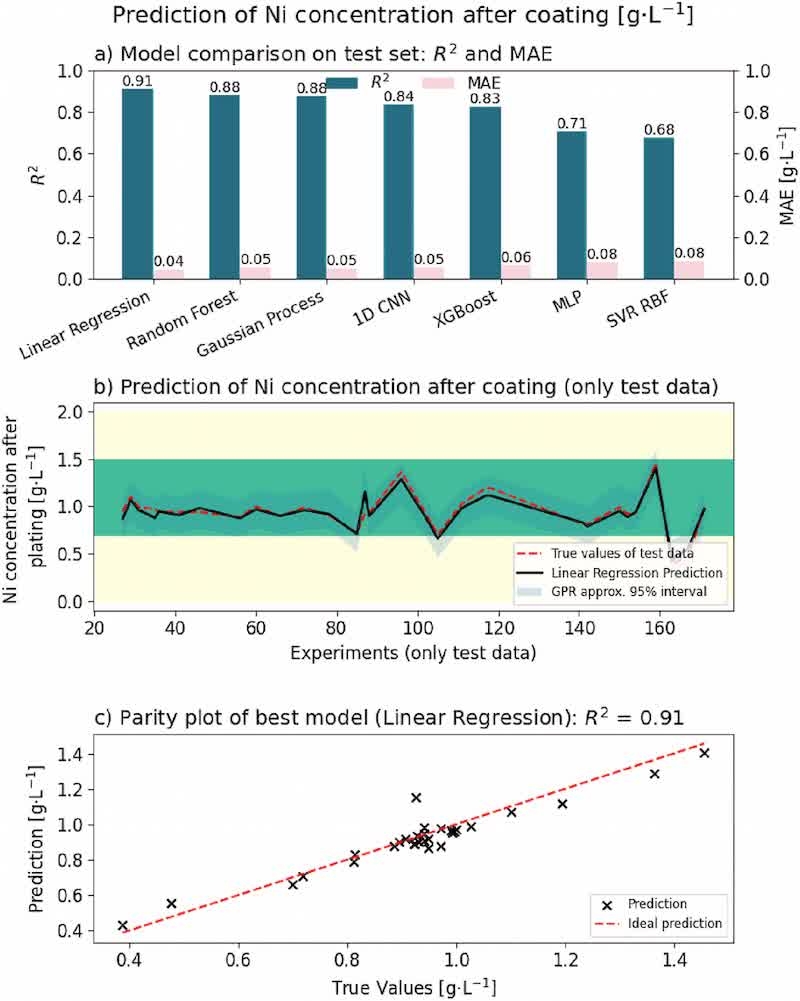
Fig. 8. Comparison of different algorithms for predicting the concentration of Ni in the electrolyte after coating.
4.2. Scenario 2a: modelling at product level in test environment
In this research, the coating quality is defined through the corrosion protection requirements either with the coating thickness [μm], nickel ratio in coating [%] or a combination of both as a binary coating quality [OK, NOK]. The coating thickness and nickel ratio are modelled with regression algorithms, whereas these values can be labelled and assigned to the classes “OK” and “NOK” in a classification task. If both the coating thickness and the coating composition are in a good quality range, the binary coating quality is set as OK.
4.2.1. Mean coating thickness [μm]
For modelling the mean coating thickness, the following parameters were used as input variables with applied stratified sampling:
- Temperature [°C],
- Current density [A∙dm−2],
- Zn concentration before the coating [g∙L−1]
- Ni concentration before the coating [g∙L−1]
Fig. 9 illustrates the performance of different algorithms, as well as the overall prediction trend of the best model, along with supplementary details regarding the quality classes. Fig. 9a shows that nonlinear models perform best for this target variable, with the Random Forest achieving R2 of 88% and slightly outperforming XGBoost with R2 of 87%. Taken into the consideration, that coating thickness values range between 5 and 12.5 μm, an MAE of 0.45 μm can be regarded as a good predictive performance. Even though the experiments included varying coating thickness qualities, Random Forest is able to predict the values with a low deviation from the true values, including the regions with pronounced local variations, as shown in Fig. 9b. The green area in the graph represents the optimal coating thickness window, whereas the yellow areas indicate the upper and lower tolerance limits. Prediction within the red area correspond to critical coating thickness values and highlight operating conditions associated with increased process risk. The uncertainty GPR band shows narrower intervals in stable regions and pronounced widening around abrupt thickness changes, where the uncertainty can be associated with stronger nonlinearity or reduced data support. Since most of the test values lie within the approximate 95% interval, the model is considered well calibrated, but some regions of the prediction are to be treated with caution.
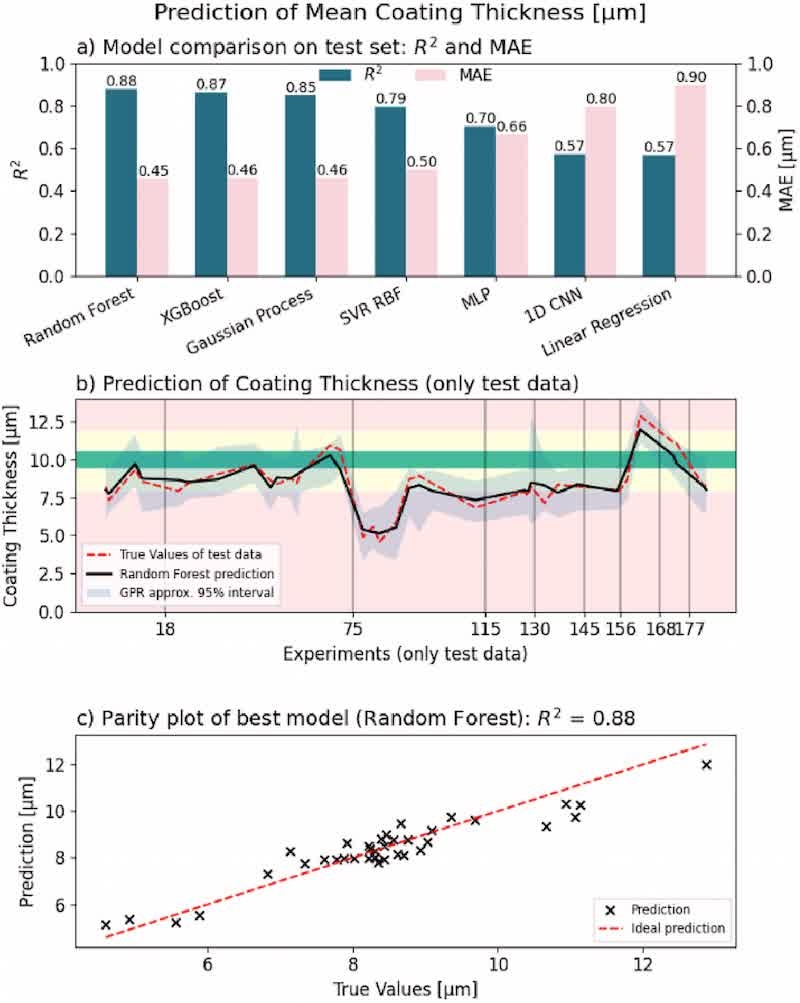
Fig. 9. Comparison of different algorithms for predicting the coating thickness.
4.2.2. Mean nickel ratio in coating [%]
For effective protection, the nickel mass fraction should reach 13-14% of the coating. When modelling the coating composition, the best results were achieved with the following input features:
- Current density [A∙dm−2]
- Zn concentration before the coating [g∙L−1]
- Ni concentration before the coating [g∙L−1]
Parameters such as temperature and coating time showed no effect on the model's predictions and were therefore not included.
Fig. 10 presents the modelling results for the mean nickel ratio and indicates a more complex prediction task than for coating thickness. Fig. 10a shows that nonlinear models clearly outperform linear regression, with the Random Forest achieving the best performance on the test set (R2 = 86% and lowest MAE = 0.53%), followed by the MLP and Gaussian Process models. The low performance of the Linear Regression suggests a nonlinear nature of nickel incorporation into the coating layer. As shown in Fig. 10b, the Random Forest prediction closely follows the overall trend of the experimental data and is able to capture most local variations, although larger deviations occur in regions with abrupt changes in nickel ratio. The GPR band (R2 = 78%) widens in these regions, reflecting that this particular model has lower performance and therefore increased uncertainty most likely due to stronger nonlinearity or data scarcity. The parity plot in Fig. 10c confirms good overall agreement between predicted and measured values, with some increased deviations at lower nickel ratios. Overall, the results demonstrate that nonlinear models provide reliable predictions for the nickel ratio, while the uncertainty information highlights regions where predictions should be interpreted with increased caution.
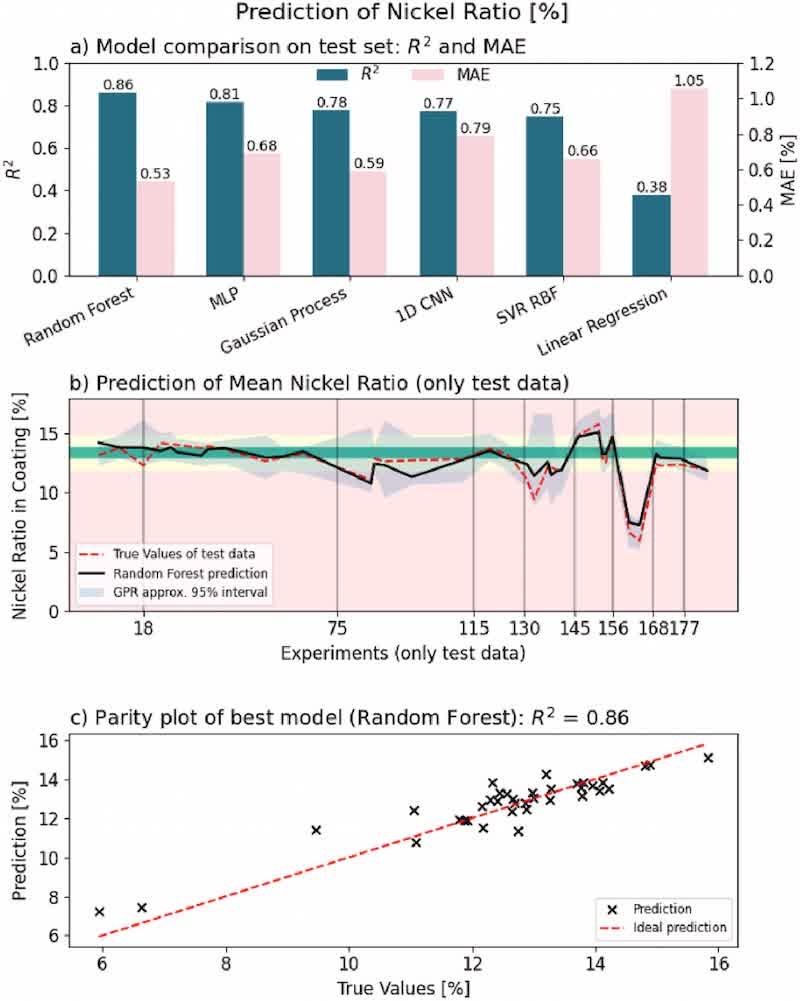
Fig. 10. Comparison of different algorithms for predicting the nickel ratio in the coating.
4.2.3. Binary coating quality [OK/NOK]
The coating quality is derived on the basis of defined specifications for the coating thickness and composition resulting in a class with a good coating quality (OK) or a poor coating quality (NOK). A Random Forest Classifier was applied using only temperature [°C] and current density [A∙dm−2] as model inputs. Zn and Ni concentrations were excluded from the final classifier because they did not improve classification performance in the tested feature combinations. Other classification models, including SVM with RBF kernel, logistic regression, Naive Bayes, and k-nearest-neighbors, were also evaluated. However, these approaches achieved accuracies of less than 75% and therefore performed lower than the Random Forest model. For this reason, only the Random Forest classifier is presented and discussed in detail.
Fig. 11a depicts the confusion matrix with the binary classes. The model has a high accuracy of 92%, meaning that it is able to mostly classify both classes correctly. As can be seen in the confusion matrix, the model only had false positives in three cases, leading to a precision of 86%. The ROC-Curve in Fig. 11b shows that the model is able to separate between an OK and NOK part, having a high true positive and a low false positive rate. To better understand the model decision making a decision space graph is illustrated in Fig. 11c. Based on the electrolyte manufacturer's guidelines, the optimal conditions for a good coating quality require a current density of 0.8 A dm−2 and a temperature of 30 °C. However, according to this graph, higher temperature does not have a negative impact on the coating quality. Whereas it is confirmed, that a lower current density leads to a thinner coating, resulting in a NOK part. Overall, the model shows promising results.
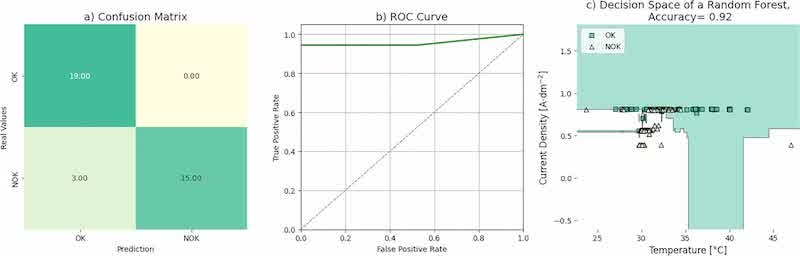
Fig. 11. Confusion matrix, ROC curve, and decision space of the Random Forest classifier for predicting binary coating quality.
4.3. Discussion of modelling in test environment
The following section discusses the modelling results of an alkaline Zn-Ni coating process at both the process and product-level. Table 3 shows some of the most important parameters influencing the electrolyte bath.
Table 3. Literature-based effects of selected bath and process parameters on electroplating behaviour (excerpt from (Gugua et al., 2024)).
| Parameter | Effects |
| Metal ion concentration | Deposition rate; thickness of coating |
| Temperature | Deposition rate |
| Current density | Deposition rate; structure of deposited layer |
| Agitation speed | Distribution of metal ions |
The experimentally obtained data for the coating time, temperature, current density, and barrel speed (influences agitation speed), as well as the Zn and Ni concentrations before coating, were considered as input parameters.
1) Discussion of models at process level
At the process level, the metal concentrations of zinc and nickel in the electrolyte after coating were predicted. These concentrations were also determined experimentally, see “True Values” in Fig. 7, Fig. 8, and are used to verify the predicted concentrations and the prediction rate in the form of the criteria R2 and MAE. According to Table 3, the temperature, current density, and metal concentrations all have a directly proportional influence on the deposition rate. This means that the higher deposition rates lead to higher consumption of metal ions in the bath. The barrel speed affects the amount of zinc or nickel in the coating. Thus, the more of each element is incorporated into the coating, the greater the decrease in the concentration of that element in the electrolyte. The coating time is not listed in Table 3. However, one would expect that as the coating time increases, the layer thickness increases evenly and thus the metal concentrations in the electrolyte decrease linearly. When modelling with all the input factors mentioned, the predictions were initially inadequate. Through multiple modelling with a varying number and combination of input factors, it was determined that better results were achieved when the experiments with the coating time and barrel speed were omitted from the test dataset. This could be due to the fact that the available data is insufficient to model these relationships, which may be more complex than the empirical values. In the case of coating time, only 10 experiments with varying settings were carried out simultaneously with the barrel speed, and in the case of isolated barrel speed experiments, there were 9. Therefore, both parameters were not taken into account in the process-level modelling.
When predicting the Zn concentration after coating, the Random Forest Regressor (RFR) algorithm showed the best results with R2 = 87%, and MAE = 0.28. This indicates that changes in the input factors have a directly proportional effect on the Zn concentration after coating, as shown in Table 3, especially when the data with all parameter variations are included in the modelling in equal parts due to stratified sampling. When predicting the Ni concentration, the Linear Regression showed the best result with R2 = 91%, and MAE = 0.04. Here, too, a high prediction accuracy was achieved, but a linear correlation was not expected for various reasons: The zinc-nickel deposition is unusual, since zinc despite being less noble, tends to deposit more readily than nickel (anomalous Zn-Ni codeposition). This can be explained by the hydroxide suppression effect. As it happens, a secondary process of hydrogen evolution takes place at the same time during which the medium is alkalized. The increased pH of the electrolyte solution contributes to the formation of the adsorptive zinc hydroxide. Consequently, metallic zinc is reduced at the cathode due to the adsorbed hydroxide film that obstructs the transport of nickel to the electrode's surface. This leads to the suppression of both nickel and hydrogen reduction (Burliaev et al., 2021; Son et al., 2023). Additionally, the hydrogen generated as a by-product at the cathode (Hydrogen Evolution Reaction (HER)), along with the fact that this reaction is kinetically favoured over nickel deposition, adversely impacts the deposition of nickel. (Zhang et al., 2014). The consumption of protons during hydrogen formation at the cathode also leads to a significant increase in pH and an accumulation of OH− ions. Zinc ions can form stable hydroxo complexes with OH− ions that are highly soluble, allowing zinc to be deposited. In the case of nickel, however, increased concentrations of OH− lead to the formation of nickel hydroxide, which is poorly soluble and causes nickel to precipitate, making it unavailable for deposition. In summary, varying the input parameters in the case of nickel triggers many further effects that influence each other. However, since the data set consists mainly of data with variations in temperature and metal concentrations–both parameters that are directly proportional to Ni concentration, as well as variations in current density in the medium current density range, in which hydrogen evolution is not yet so pronounced, it is possible that a process window was investigated in which the relationships actually behave linearly. However, the predictive quality of the model outside this process window should be viewed with caution and validated by further experimental data, if possible, also using multi-parameter variations.
2) Discussion of models at product level
Modelling at the product level was based on the prediction of the layer thickness, the prediction of the nickel ratio in the coating, and the prediction of the binary coating quality based on the combination of both output factors. The input factors were the temperature, the current density, and the metal concentrations before coating. For the prediction of the coating thickness, good results were again achieved with the RFR algorithm and stratified sampling (R2 = 88%, MAE = 0.45). This corresponds well with the empirical observations described above.
A Random Forest classifier was used to predict the binary coating quality. With the input factors temperature and current density, a high accuracy of 92% was achieved, which means that the model is able to classify both classes (OK/NOK) largely correctly. As discussed above, both input factors have a directly proportional effect on the coating thickness and an indirectly proportional effect on the nickel content in the layer, which is directly proportional to the availability of Ni2+ in the electrolyte. Thus, there is also an indirect proportionality between the layer thickness and the nickel content in the layer, which further improves the prediction accuracy. The decision space graph also shows that significantly higher temperatures, above 40 °C instead of max. suggested 32 °C, can be set in wide current density ranges in order to still classify the coatings as “OK.” This result was not expected, as the nickel availability in the bath should decrease with increasing temperature and increasing current density, as discussed previously. The high accuracy of the model can perhaps be explained by the fact that, in the higher temperature range considered in the experiment, the effects on the nickel concentration in the bath are not yet so greatly increased and the current density range considered in the experiment was within the range specified by the manufacturer. Further tests would be needed to check whether an “OK” classification can still be achieved at 40 °C and a very high current density of 1.5 A dm−2, for example. It should be noted that no long-term corrosion tests were conducted in order to keep the testing effort low with respect to cost–benefit considerations. The majority of the tests were carried out with parameter variations within the parameter ranges specified in the product data sheet. For these, the electrolyte manufacturer has ensured corrosion stability while maintaining the coating composition and thickness. However, it is correct that corrosion tests would have been useful for temperature variations above 35 °C, but only to confirm the theory that these layers are also corrosion-stable while maintaining the layer composition and thickness. However, since this data was not collected for the entire data set, it could not have been taken into account in the modelling. On the other side, increasing temperatures, especially above 40 °C, have a significant influence on the resulting layer properties, including additive consumption, microstructure, nickel distribution, nickel content, etc., and thus also have a negative effect on corrosion resistance. In order to better highlight these differences, additional layer properties, e.g., long-term corrosion must be recorded in further studies.
A direct comparison with previous studies is limited because most studies are based on Hull cells, beaker experiments, fresh electrolytes, or proprietary laboratory formulations. In contrast, the present study used a 20 L test environment that was designed to replicate an industrial Zn-Ni process as closely as possible. Moreover, only routinely available process variables were used as inputs. This distinguishes the proposed approach from studies that rely on detailed additive concentrations or image-based quality descriptors. The results therefore support the applicability of black-box models under more realistic industrial constraints, while also showing that model outputs must be interpreted against electrochemical process knowledge.
These, in turn, are factors that are monitored online in practice, or at least at short intervals, and can therefore be used for process control. Furthermore, the cited studies were generally purely data science investigations. This means that algorithms were selected and tested, a performance evaluation was carried out, for example using the metrics XGBoost or F1 score, and the models were evaluated in terms of industrial suitability based on their robustness, interpretability, or even computing time. However, there was a general lack of industrial-technical discussion, meaning that only patterns in the datasets were examined, but it was not clarified whether these were plausible. With a black box model, there is a risk that correlations will be learned that are only coincidental and that the model will deliver incorrect decisions. In addition, the model should expand existing expertise as much as possible and not just provide numbers.
5. Knowledge transfer and industrial transferability
In a subsequent step, the knowledge derived from modelling the dataset in the test environment was transferred to the industrial context. In addition to replicating the industrial Zn-Ni process in the test environment, the industrial process was modelled using the same input parameters (features) and prediction targets as previously described. For comparison, two approaches were evaluated: in the first, the models were trained exclusively on the original industrial dataset (OID, n = 151), whereas in the second, the dataset from the test environment (n = 186) was incorporated into the industrial dataset as a form of augmented dataset (AD, n = 337).
5.1. Scenario 1b: modelling at process level in industrial environment
As shown in Table 4, the Zn and Ni models achieved high predictive performance when trained on the OID. This indicates that process level modelling can be successfully implemented in the industrial environment, particularly because the required data can be collected during regular production without interfering with day-to-day operations. In this setting, the industrial process itself provides the most relevant data basis for modelling bath composition.
Table 4. Overview of modelling results (Gaussian Process) with the original industrial dataset.
| Target variable | Original industrial dataset (OID) | Augmented dataset (test + industrial) (AD) |
| Zn concentration | R2 = 92%; MSE = 0.15; MAE = 0.12 | Not feasible |
| Ni concentration | R2 = 94%; MSE = 0.02; MAE = 0.01 | Not feasible |
However, transferring process-level information from the test environment to the industrial environment proved infeasible. The main limitation arises from differences in operating conditions. In the industrial process, Zn anodes were immersed in the electrolyte during coating. However, this intervention – and in particular the resulting changes in zinc concentrations – was not recorded, so it was not possible to determine the actual zinc consumption in the electrolyte. In the test environment, however, the Zn concentration was adjusted to the same target concentration for all batches prior to coating by adding a metal salt solution, so that the Zn concentrations measured after coating always reflected the consumption of Zn in the electrolyte. Supplementing the industrial dataset with data from the test environment for process-level modelling was not suitable. Models trained on the AD showed poor prediction performance because industrial Zn and Ni concentrations often increased after coating, whereas the test-environment data reflected a different concentration trend. This indicates that the target at process level is directly coupled to the local mass balance of the industrial bath. In the test environment, the concentration change after coating is mainly determined by metal deposition and the predefined initial bath composition. In the industrial environment, however, the measured post-coating concentration is also influenced by zinc supplied during production. Since this zinc input was neither recorded as a feature nor represented in the test environment, the same input variables can lead to opposite concentration trends in both datasets. Therefore, the AD does not describe one consistent process relationship, but combines two different concentration mechanisms.
Therefore, cross-environment knowledge transfer could not be validated at process level in this study. The experimentally generated data were only suitable for product-level augmentation, where the target variables were less directly affected by unrecorded industrial bath interventions.
A possible solution to overcome the data gap in zinc immersion could be a combined evaluation of time-resolved zinc concentration measurements in the coating module and current-derived zinc dosage from the dissolution module. With this approach, regularly measured Zn2+ concentrations could be synchronized with production timestamps to assign concentration changes to individual barrels, while the module current could be recorded and converted into the zinc mass supplied using Faraday's law. The actual zinc consumption per barrel can then be calculated from the difference between the zinc supplied and the net change in bath concentration, allowing for electrochemical losses and possible overcompensation. Since the module current scales with the area of the immersed anode, a controlled and reproducible anode immersion depth could be used as an indirect control variable for zinc dosing, supporting bath stability and consistent alloy composition even without direct measurements of immersion depth. Finally, collecting data in an experimental environment offers the potential to generate a broader diversity of coating scenarios that are rarely available in industrial production due to the high associated costs. Such experimentally acquired data can serve as an effective form of data augmentation, enhancing model robustness and improving generalization to industrial applications.
5.2. Scenario 2b: modelling at product level in industrial environment
For product-level modelling Random Forest was selected because it showed the best performance for the considered target variables and was therefore trained for this task. As shown in Table 5, product-level models became more robust when trained on AD. Although the test environment dataset contains only one part geometry, whereas the industrial dataset includes 43 different part types, the models were still able to generalize effectively. This improvement can be attributed to the higher diversity of the test environment dataset, which includes different experiments and deliberately produced NOK parts. In contrast, in an industrial setting the objective is to avoid producing such parts.
Table 5. Comparison of modelling results (Random Forest) with the original industrial dataset and the augmented dataset by test environment dataset.
| Target variable | Original industrial dataset (OID) | Augmented dataset (test + industrial) (AD) |
| Coating Thickness | R2 = 61%; MSE = 2.3; MAE = 1.2 | R2 = 74%; MSE = 1.2; MAE = 0.8 |
| Nickel Ratio in Coating | R2 = 35%; MSE = 0.3; MAE = 0.45 | R2 = 74%; MSE = 0.5; MAE = 0.5 |
| Coating Quality | Accuracy = 93%; ROC =0.75 | Accuracy = 82%; ROC = 0.95 |
Especially in the coating quality model the ability to recognize NOK parts improves significantly from 75% to ROC = 95%.
In contrast to the process-level targets, the product-level targets integrate the cumulative effect of the coating process on the part. Despite containing one part geometry, the test dataset includes a broader range of coating outcomes due to systematic parameter variation. This is particularly relevant for the coating quality classifier, since industrial production data are biased towards OK parts. The test data therefore add information about the decision boundary between OK and NOK, which is underrepresented in regular production.
Although the coating quality model achieved an overall accuracy of 93% when trained exclusively on OID, this result is not reliable due to the severe class imbalance in the validation data. Specifically, the dataset contained only three non-OK (NOK) parts, which is insufficient to robustly evaluate the model's ability to detect defective cases. As a consequence, the model correctly classified only one NOK part, highlighting its limited sensitivity to the minority class. This indicates that the reported accuracy is dominated by the abundance of OK parts and therefore overestimates the true predictive performance (ROC = 75%).
5.3. Comparison of process-level and product-level transferability
The comparison of both modelling scenarios shows that transferability depends on the causal proximity between the target variable and unrecorded environment-specific process interventions. Product level targets, such as coating thickness, nickel ratio, and coating quality, benefited from augmentation with test-environment data because the experimental dataset increased the diversity of coating outcomes. In contrast, process-level targets were highly sensitive to the zinc dosing mechanism in the industrial setting. Since zinc anode immersion was not recorded and was not represented in the test environment, the concentration dynamics differed between both environments. Consequently, process-level modelling was successful within the industrial environment itself, but cross-environment augmentation was not feasible.
Table 6 summarizes the resulting transferability assessment. The decisive factor is not only the similarity of the experimental setup, but whether the relevant mechanism behind the target variable is represented in both environments. For product-level targets, the test environment captures relevant coating outcomes caused by parameter variation. For process-level targets, however, the industrial zinc dosing mechanism changes the bath concentration independently of the coating outcome and must therefore be recorded explicitly.
Table 6. Summary of industrial transferability for process-level and product-level modelling.
| Modelling level | Industrial-only modelling | Test-to-industrial augmentation | Explanation |
| Process Level | Successful | Not feasible | Unrecorded zinc dosing changes concentration dynamics |
| Product Level | Partly successful | High potential | Test data add broader coating outcomes and NOK cases |
6. Conclusion and outlook
In this work, a CPPS-based data-driven modelling approach for an alkaline Zn-Ni barrel electroplating process was presented. The approach links a controlled test environment with an industrial production environment and proposes two modelling scenarios: process-level modelling of Zn and Ni concentrations in the electrolyte after coating and product-level modelling of coating thickness, nickel ratio in the coating and binary coating quality.
The results show that relevant targets in the electroplating process can be modelled with high prediction performance using only routinely available industrial process data. In the test environment, both modelling scenarios achieved good results despite the limited amount of data and the high process variability. This indicates that standard process parameters and bath concentrations are suitable input features for data-driven monitoring, even without additional sensor systems or detailed knowledge of proprietary additives.
The transfer to the industrial environment showed different results depending on the modelling scenario. At process level, modelling with the original industrial dataset was successful. However, augmentation with data from the test environment was not feasible, mainly because the industrial process includes zinc dosing by immersed Zn anodes during coating, which was not recorded in the dataset. At product level, the augmented dataset improved model robustness, especially for the binary coating quality model, since the test environment included deliberately generated NOK parts that are rarely available in industrial production.
Therefore, the main finding of this study is that knowledge transfer from test to industrial environment depends strongly on the modelling target. Modelling at product level can be beneficial with an experimental data augmentation, whereas process-level modelling requires a more complete recording of bath maintenance and dosing actions. Thus, the suitability of knowledge transfer depends on the available data and on whether the relevant process mechanisms are represented in both environments.
Future work should focus on making more extensive use of transfer learning models in practice in order to apply the acquired knowledge in a more generalized manner. To achieve this in the context of the described Zn-Ni process, changes in Zn concentrations must be monitored more closely, for example by synchronizing Zn2+ concentration measurements with current signals from the zinc dissolution module to improve process alignment across different scales. Furthermore, more general modelling objectives, such as the deviation from the target coating thickness rather than the absolute coating thickness, could be investigated to improve the transferability to different component geometries.
Written by Marija Lindnera, Rowena Ducksteinb, and Christoph Herrmannab
a: Chair of Sustainable Manufacturing and Life Cycle Engineering, Institute of Machine Tools and Production Technology, Technische Universit at Braunschweig, Langer Kamp 19b, Braunschweig, 38106, Germany
b: Fraunhofer Institute for Surface Engineering and Thin Films IST, Riedenkamp 2, Braunschweig, 38108, Germany
CRediT authorship contribution statement: Marija Lindner: Conceptualization, Data curation, Formal analysis, Methodology, Software, Validation, Visualization, Writing – original draft, Writing – review & editing. Rowena Duckstein: Conceptualization, Investigation, Methodology, Resources, Validation, Writing – original draft, Writing – review & editing. Christoph Herrmann: Funding acquisition, Project administration, Supervision, Writing – review & editing.
Declaration of competing interest: The authors declare that they have no known competing financial interests or personal relationships that could have appeared to influence the work reported in this paper.
Acknowledgements: The authors thank the German Federal Ministry of Research, Technology and Space (BMFTR) for funding the project KI-InGatec (grant agreement no. 01IS22014D). The authors also acknowledge financial support by the Open Access Publication Funds of Technische Universität Braunschweig. Additionally, the authors thank project partners Galvanotechnik Jens Holzapfel GmbH and DiTEC GmbH for providing the industrial dataset.
Data availability: The authors do not have permission to share data.
References
- Breiman, L., 2001. Random forests. Mach. Learn. 45 (1), 5–32. https://doi.org/10.1023/ A:1010933404324.
- Burliaev, D.V., Kozaderov, O.A., Volovitch, P., 2021. Zinc-nickel alloy coatings: electrodeposition kinetics, corrosion, and selective dissolution. A review. kcmf 23 (1), 3–15. https://doi.org/10.17308/kcmf.2021.23/3292.
- Chen, T., Guestrin, C., Xgboost, Krishnapuram B, Shah M, Smola A, Aggarwal C, Shen D, Rastogi R, 2016. Proceedings of the 22nd ACM SIGKDD International Conference on Knowledge Discovery and Data Mining. ACM, San Francisco California USA. New York, NY, USA, 13 08 2016 17 08 2016.
- Ding, X., Liu, J., Yang, F., Cao, J., 2021. Random radial basis function kernel-based support vector machine. J. Franklin Inst. 358 (18), 10121–10140. https://doi.org/ 10.1016/j.jfranklin.2021.10.005.
- Gugua, E.C., Ujah, C.O., Asadu, C.O., Kallon, DV von, Ekwueme, B.N., 2024. Electroplating in the modern era, improvements and challenges: a review. Hybrid Adv. 7, 100286. https://doi.org/10.1016/j.hybadv.2024.100286.
- Ige, A.O., Sibiya, M., 2024. State-of-the-Art in 1D Convolutional Neural Networks: a Survey. IEEE Access 12, 144082–144105. https://doi.org/10.1109/ ACCESS.2024.3433513.
- Jeon, S.-B., Son, B.-K., Choi, J.-W., Son, I., 2023. Effects of organic additives on alkaline non-cyanide zinc electroplating. Coatings 13 (4), 781. https://doi.org/10.3390/ coatings13040781.
- Jo, W., Yoon, Y., Kim, M.J., 2025. Machine learning for voltammetric analysis of Cu electroplating additives: electrochemically-guided design for dataset structure. J. Electroanal. Chem. 999, 119552. https://doi.org/10.1016/j.jelechem.2025.119552.
- Kanani, N., 2020. Galvanotechnik: Grundlagen, Verfahren Und Praxis Einer Schlüsseltechnologie, third ed. Hanser, München.
- Katirci, R., Aktas, H., Zontul, M., 2021. The prediction of the ZnNi thickness and Ni % of ZnNi alloy electroplating using a machine learning method. Transac. IMF 99 (3), 162–168. https://doi.org/10.1080/00202967.2021.1898183.
- Katirci, R., Danaci, K.I., 2023. The optimization of nickel electroplating process parameters with artificial intelligence methods. J. Appl. Electrochem. 53 (10), 2077–2089. https://doi.org/10.1007/s10800-023-01892-1.
- Katirci, R., Tekin, B., 2022. The optimization of the zinc electroplating Bath using machine learning and genetic algorithms (NSGA-II). Bitlis Eren Üniversitesi Fen Bilimleri Dergisi 11 (4), 1050–1058. https://doi.org/10.17798/bitlisfen.1170707.
- Katırcı, R., Akgün, H.M., Tekin, B., K¨omürkaya, O.G., Zontul, M., Kaynar, O., 2022. Classification of zinc-coated parts in accordance with their brightness degree using deep learning techniques. J. Turkish Chem.Soc.Section B: Chem. Eng. 5 (2), 145–156. https://dergipark.org.tr/en/pub/jotcsb/issue/70634/1156543#article_cit e. (Accessed 22 November 2025).
- Kumar, R., Dhara, T., Hu, H., Chakraborty, M., 2022. Visualization-based prediction of dendritic copper growth in electrochemical cells using convolutional long short-term memory. Energy AI 10, 100203. https://doi.org/10.1016/j.egyai.2022.100203.
- LeCun, Y., Bengio, Y., Hinton, G., 2015. Deep learning. Nature 521 (7553), 436–444. https://doi.org/10.1038/nature14539.
- Leiden, A., Brand, P.-J., Cerdas, F., Thiede, S., Herrmann, C., 2020. Transferring life cycle engineering to surface engineering. Proced. CIRP 90, 557–562. https://doi.org/ 10.1016/j.procir.2020.02.132.
- Lindner, M., Duckstein, R., Mennenga, M., Herrmann, C., 2025. Towards real-time condition monitoring of electroplating plants. In: Kohl, H., Seliger, G., Dietrich, F., Mur, S. (Eds.), Sustainable Manufacturing as a Driver for Growth. Springer Nature Switzerland, Cham, pp. 429–436.
- Lotfi, N., Aliofkhazraei, M., Rahmani, H., Darband, G.B., 2018. Zinc–Nickel alloy electrodeposition: characterization, properties, multilayers and composites. Prot Met .Phys. Chem. Surf. 54 (6), 1102–1140. https://doi.org/10.1134/ S2070205118060187.
- Luo, H., Gou, Q., Zheng, Y., Wang, K., Yuan, R., Zhang, S., et al., 2025. Machine learning- assisted high-donor-number electrolyte additive screening toward construction of dendrite-free aqueous zinc-ion batteries. ACS Nano 19 (2), 2427–2443. https://doi.org/10.1021/acsnano.4c13312.
- Oliveira, LML de, Da Silva, F.L., Janissek, P.R., Toniolo, J.C., 2025. Technological advances in electroplating: artificial intelligence to predict zinc coating thickness on sae 1008 low carbon steels. Quim. Nova. https://doi.org/10.21577/0100- 4042.20250103.
- Praveen, B.M., Venkatesha, T.V., 2012. NEW BRIGHTENER FOR Zn-Ni ALLOY PLATING FROM SULFATE BATH. Chem. Eng. Commun. 199 (6), 812–822. https://doi.org/ 10.1080/00986445.2012.629174.
- Rai, P.K., Gupta, A., 2025. Predictive modeling of pulse-electrodeposited Cu-Zn alloy and dealloying for porous electrode fabrication. RSC Adv. 15 (19), 15086–15107. https://doi.org/10.1039/d5ra00613a.
- Rasmussen, C.E., 2006. Gaussian Processes for Machine Learning. MIT Press, Cambridge, Massachusetts.
- Ren, J., Kang, Q., Feng, S., Sun, Y., Tan, Y.T., Xiao, G., 2026. Machine learning-based multi-objective optimization framework for industrial black nickel electroplating. J. Intell. Manuf. 37 (2), 849–865. https://doi.org/10.1007/s10845-025-02573-w.
- Sanchez Lasheras, F., García Nieto, P.J., Cos Juez, FJ de, Vil´ an Vil´ an, J.A., 2014. Evolutionary support vector regression algorithm applied to the prediction of the thickness of the chromium layer in a hard chromium plating process. Appl. Math. Comput. 227, 164–170. https://doi.org/10.1016/j.amc.2013.11.031.
- Son, B.-K., Choi, J.-W., Jeon, S.-B., Son, I.-J., 2023. Concentration influence of complexing agent on electrodeposited Zn-Ni alloy. Appl. Sci. 13 (13), 7887. https:// doi.org/10.3390/app13137887.
- Sun, Y., Tan, Y.T., Zhao, Y., Teo, A.Z.H., Zhou, Y., Wong, J.K.S., 2024. Machine learning approach for process optimization of black nickel electroplating. Int. J. Adv. Manuf. Technol. 135 (9–10), 4715–4730. https://doi.org/10.1007/s00170-024-14606-4.
- Thiede, S., Juraschek, M., Herrmann, C., 2016. Implementing cyber-physical production systems in learning factories. Proced. CIRP 54, 7–12. https://doi.org/10.1016/j.procir.2016.04.098.
- Zaky, A.M., Assaf, F.H., Ali, F.E.Z.A.H., 2011. Electrochemical behavior of Zn-Ni alloys in borate buffer solutions. In: ISRN Materials Science, 2011, pp. 1–6. https://doi.org/ 10.5402/2011/356863.
- Zhai, S., Sugio, K., Sasaki, G., Hino, M., 2025. Hardness prediction of electrodeposited Ni-W alloy coatings using machine learning. Mater. Today Commun. 44, 112018. https://doi.org/10.1016/j.mtcomm.2025.112018.
- Zhang, P., Wang, M., Yang, Y., Zheng, D., Han, K., Sun, L., 2014. Highly efficient molecular nickel catalysts for electrochemical hydrogen production from neutral water. Chem. Commun. 50 (91), 14153–14156. https://doi.org/10.1039/ c4cc05511j.