


Controlling and dosing electrolytes is a key challenge in the operation of electroplating process chains. Electrolyte components are continuously degraded and dragged out during the production process.
This process is influenced by a variety of internal and external factors such as process parameters, the electrolyte itself, anodes, the substrates and the production environment. The exact analytical measurement of the electrolyte composition requires extensive analytical equipment and typically cannot be completely realized within an industrial plating company. Therefore, this paper presents a model-based approach, integrated in a cyber-physical production system, for controlling and dosing electrolytes. A mathematical resource flow model is the basis for a dynamic agent-based simulation. This model uses available data from the manufacturing execution system and enterprise resource planning system to model the current composition of the electrolyte. The approach is successfully validated for two different electrolyte substances at an industrial acid zinc–nickel barrel plating process chain for automotive parts.
1 Introduction
Electroplating is a coating process in which metal ions are deposited electrolytically or electroless on a cathode from mostly aqueous solutions that contain metal salts. The deposited coatings enhance the surface properties of a part in order to fulfil a certain functionality, which is not given by the substrate material of the part itself [1]. The coatings from electroplating can lead to a higher corrosion and wear resistance, a defined tribological, optical or decorative behavior or to a matching interface behavior [2]. Examples for decorative coatings are glossy chrome-plated bathroom fittings or automotive interior and exterior parts made of plastic. However, functional changes to the surface like corrosion and wear resistance are often in the foreground [3]. Coatings from electroplating can increase the energy and resource efficiency of the product system by increasing the life time of the product as well as by the substitution of other more resource intensive materials [4].
Approximately 18,000 surface treatment installations are in operation in the EU-15 [5]. There are basically two types of plating companies. The first type is the so called job plating company that plates products on behalf of other companies. More than 55% of the installations are installed at job plating companies of which most are small and medium-sized enterprises (SME) with 10 to 80 employees [5]. The products usually have a broad spectrum in terms of type, size and geometry, which is a great challenge for job plating companies. The second type of company is so-called company platers, which plate their own products as an organizational unit. This type can be found in all types and sizes of companies. Especially the first type faces challenges in the electrolyte monitoring and dosing due to the different coatings and drag-out behavior of the broad spectrum of products.
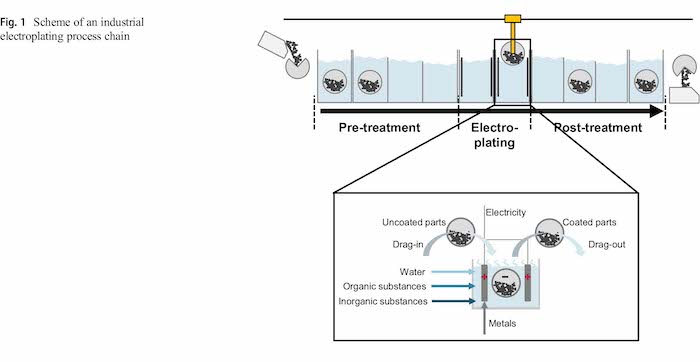
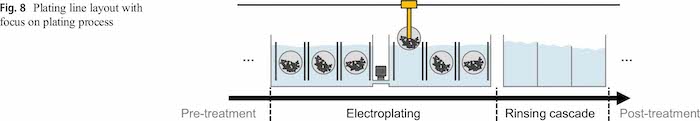
A particular advantage of electroplating processes is their suitability for mass finishing. Especially in barrel processes, large quantities of small parts such as screws, nuts or bolts can be coated at the same time [6]. These parts are often plated with sacrificial corrosion protection like zinc or zinc–nickel layers. The electroplating lines for mass finishing are typically automated or at least partly automated. Figure 1 illustrates the typical set-up of an automated electroplating process chain including pre and post-treatment processes as well as details from the electroplating process. The transport between the tanks is realized with a rail mounted hoist (RMH). It is state of the art that physical process parameters such as current, voltage, temperature, goods movement and barrel rotation are controlled and recorded online via a central computer in these plating lines [7].
Analytical measurements, especially for organic substances, are complex and typically only conducted once a month. The content of organic substances of an electrolyte is unclear in the meantime, and only if problems occur, additional measurements are conducted. However, this is too late as the problems already arose and cause high cost for reworking and repair. Therefore, a predictive maintenance approach, which monitors the electrolyte substances content at low efforts and cost, is required.
With new developments and declining costs in the field of sensor technology, chemical parameters such as pH or conductivity will increasingly be recorded online and also used for automated process control [7]. Although online analyzing devices are well established in the production of printed circuit boards, the limits of online measurement are currently still the analytics of organic electrolyte additives. The composition of these substances is mostly only known to the process supplier, and the use of the online analyzing devices is not affordable [8]. This is especially challenging for SME with limited resources.
One aspect of the current trend toward the digitalization and industry 4.0 is to handle high complexities in manufacturing systems with cyber-physical production systems (CPPS) [9, 10]. CPPS can be used to handle complex flexible manufacturing systems, as which electroplating lines of job plating companies can be considered, by representing the physical systems in a cyber-environment [11]. Therefore, this paper describes a cyber-physical production system for improving the electrolyte process monitoring and controlling in an economical way, especially in SMEs.
2 Research background
2.1 Electrolyte control and dosing
The process control of electrolytes in production operation— in particular the care and maintenance of the chemical composition—is a permanent challenge for plating line operators. Usually, the process capability is provided by using process analysis methods [12] and their results for the care and maintenance of the electrolytes. Since the coating quality is usually not directly measurable in the process, it is achieved by adhering to procedural tolerance limits. It is assumed that the coating meets the quality requirements if the tolerance limits are observed [8]. In order to comply with the tolerance limits, the analysis methods must be selected taking into account the instrumental costs, the personnel expenses, the quality, and availability [13].
Electrolytes for electrodeposition are complex solutions that are composed of a large number of components. The components are, one the one hand, inorganic substances such as the coating metals, which are dissolved in the form of salts, conducting salts and acids or bases and on the other hand organic substances such as complexing agents, wetting agents, buffers and brighteners [1]. The concentrations and the tolerance limits of these substances are specified by the process supplier. The concentrations of the substances are given as the quantity of substance per volume. For solids, the concentration is given as mass per volume (e.g. g/l) and for liquids as volume per volume (e.g. ml/l).
The electroplating process is affected by a number of factors (Fig. 2). Internal factors are the process parameters, the electrolyte itself and the anodes, and external factors can be divided into factors associated with the product and the production environment [14].
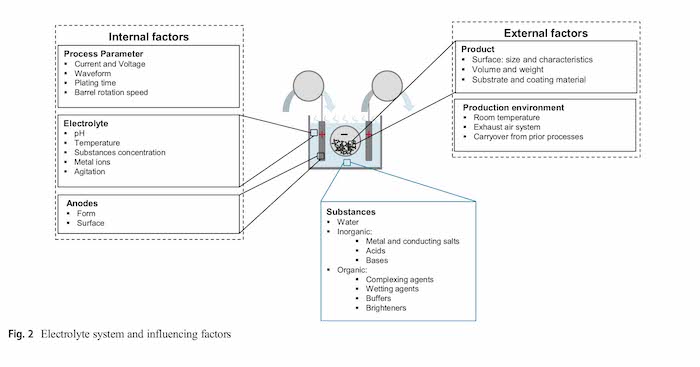
All factors affect the control and dosing strategy, and they directly influence the condition and the concentration of electrolyte ingredients. During the deposition process the components of the electrolyte are continuously consumed. The overall consumption of a substance usually consist of several partial consumption quantities: electrochemical degradation (chemical conversion), deposition of metal(s) and the incorporation of the substance into the coating, for example organics [8]. In addition, electrolyte is carried into the next process step through residues that remain on the parts after the deposition. This process is usually called drag out.
The correct concentration of the electrolyte substances is crucial to ensure a resource and energy-efficient electroplating process [15]. In the worst case the metals cannot be deposited properly and rework is required. In order to meet the tolerances specified by the process supplier, it is necessary to replenish the consumed substances. The consumption can be calculated as the difference between a measured concentration determined by chemical analysis and the specific target concentration of the substance. Many basic ingredients of plating, pre-and post-treatment electrolytes, such as metals, conductive salts, acids and bases, usually can be analysed by titration in the company laboratory. Titration is an effective method with a high availability and comparatively low costs. Another option for determining the metal content in the electrolyte is the X-ray fluorescence (XRF), which is also suitable for automated online monitoring of electrolytes but more cost intensive [7]. Organic ingredients such as complexing agents, brighteners and wetting agents are usually not analysed by the plating company itself, because of their unknown composition, which is typically company secret of the process supplier. Therefore, the analysis is carried out by the process supplier at larger, often monthly, intervals. The organic ingredients cannot be analysed quantitatively with simple methods. Therefore, instrumental analysis must be used, for example high-performance liquid chromatography (HPLC) and ion chromatography (IC) [16]. Based on the feedback from the process supplier, the plating company can make appropriate additions or adjustments to the electrolyte.
Due to high costs, job plating companies usually are not equipped with their own HPLC [8]. As already discussed, online HPLC devices are available from a technical point of view, but are only established in the circuit board industry as the higher electrolyte and process cost justify the even higher investment [7, 13, 16].
Usually, the organic additives are subsequently dosed, based on specifications from the process supplier in between two measurements. The control variable for the automated replenishment is usually ampere-hours. On this basis, the organic additives are replenished into the electrolyte with dosing pumps. Between the measurements from the process supplier the current concentration of wetting agents, brighteners or organic complexing agents in the electrolyte is unknown. In order to still guarantee the coating quality, qualitative methods are used to analyze the condition of the electrolyte [13]. With defined deposition samples, plated in the Hull cell [17], deviations from an expected appearance of the layer can be determined [18]. On this basis, stepwise electrolyte additions can be made in order to correct the electrolyte composition. The disadvantage of the Hull-cell test for process control is the fact that deviations in the electrolyte composition are only noticed when they already have a visible effect on the layer quality. This process control strategy usually does not allow a constant quality and a predictive maintenance approach.
Table 1 summarizes the typical analysis methods used in SME companies for the different electrolyte ingredients. The properties in terms of efforts and cost are rated to compare and check their suitability towards a constant process monitoring in plating companies.
In addition, further secondary values such as pH or specific gravity can be measured. These measurement methods do not indicate the concentration of an ingredient, but properties which are the result of concentrations of specific ingredients. However, for example the pH value can be used as control size because low-cost measurements methods are available.
Due to the different measurement methods and the frequency of the measurements, complete data sets on the condition of the electrolyte are only available irregularly. The longest time interval between two measuring points can be found in analyses of the organic additives that are carried out by the process supplier for the plating company. The additives have a major influence on essential coating properties such as the alloy composition or the gloss of a layer. Due to the large time intervals between measurements, the development of the ingredients concentration between the analyses of the organic additives in the electrolyte can only be assessed qualitatively. The continuous simulation of the electrolyte ingredients as part of a simulation of the whole electroplating line could be a solution to close this data gap.

2.2 Simulation of manufacturing systems
Simulation describes the representation of a system with its dynamic processes and the development over time in an experimentable environment which allows to reach findings which can be transferred back to reality [19]. A major categorization of simulation models is the separation into static and dynamic models as well as the separation into deterministic and stochastic models [20]. Due to the time-and event-depended change of electrolyte ingredients, the simulation of electrolytes as part of electroplating lines is a dynamic simulation task with mostly deterministic properties.
Four simulation paradigms are available and commonly used: discrete event, dynamics systems, agent based and system dynamics [21]. The electrolyte itself can be modelled as dynamic system for which continuous variables are applied. However, some influences on the electrolyte, e.g. the drag-in, are discrete events from the whole plating system.
To improve industrial manufacturing processes, a better understanding of the process-structure-property relation is required [22, 23]. Computational simulation models allow to gain insights of the process-structures-properties relations [24]. Transferred to the electrolyte, a clear relation between the electroplating process parameters, the achieved electrolyte/coating structures and properties allow developing measures to increase the process quality and stability. The electroplating process parameters directly influence the electrolyte’s structure, in particular the electrolyte composition. This electrolyte structure determines the electrochemical properties of the electrolyte and finally of the plating process. An important basis for the development of the electrolyte structure is a balance of the material flows, which was already introduced in Figs. 1 and 2. Therefore, the determination and mathematical description of the relevant material flows are an essential element of a successful simulation.
2.3 Current research contributions and demand
In the last decades, other surface treatment processes, such as physical vapour deposition, became available for largescale industrial applications at lower cost [25, 26] and set the electroplating industry under pressure to produce higher quality surfaces at lower cost and environmental impacts. The resulting requirements for increasing quality and stability in electroplating processes ask for a higher process transparency in the composition of electrolyte components. Also, external stakeholders like environmental authorities ask for a clear monitoring of critical substances [27].
Monitoring of electrolyte components with analytical methods is possible from a technical point of view, but not economically feasible in the electroplating industry due to high analytical and personnel efforts. Further, analytical measurements only consider the past development and are not working predictive. Therefore, a model-based approach shall allow a better understanding of the process-structure-properties relation with computational methods. Past research contributions modelled the development of electrolyte components consumption in lab scale environment, but without a direct transferability to an industrial scale. Also, a direct integration into the IT environment of the plating line operators is not available, which is essential for any practical implementation.
Main research contributions towards modelling and simulation of electrolyte composition for electroplating and the surface technology are a MATLAB/Simulink-based electrochemical engineering toolbox developed by Giebler [8]. This toolbox allows modelling the continuous-discrete character of electrolytic and wet-chemical plating fluids based on a detailed physical model. However, this approach is only validated for a lab-scale plating process and due to modelling on chemical reactions level in the electrolyte simulation a transfer to industrial electrolytes is difficult. Nagel developed a mathematical model to model the resource flows in electrochemical plating lines with a focus on the process chain and specifically the rinsing fluid [28]. A validation by comparing the simulation results with analytical measurements is not available. Xu et al. modelled an alkali zinc plating process in detail based on the chemicals reactions in the electrolyte [29]. Again, this approach lacks a validation with analytical measurements. In summary, none of those approaches is built for industrial electroplating processes and verified in such an environment. In addition, the discussed approaches cannot be used for a direct control in production operation as part of CPPS.
To tackle these issues, the newly developed approach shall strongly contribute to research through a validated model-based analysis, control and dosing CPPS approach for electroplating electrolytes. In contrast to analytical approaches, the monitoring effort is reduced significant and a seamless monitoring is possible. From current electrolyte simulation approaches it can be delimited by the integration of manufacturing IT systems which enables an implementation in industrial system and a validation with industrial data.
3 Cyber-physical production systems approach for model-based electrolyte dosing and control
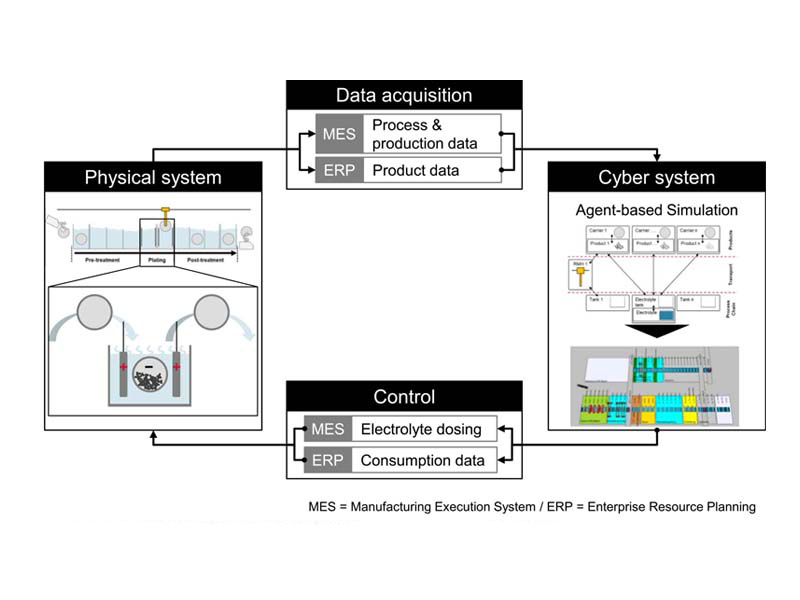
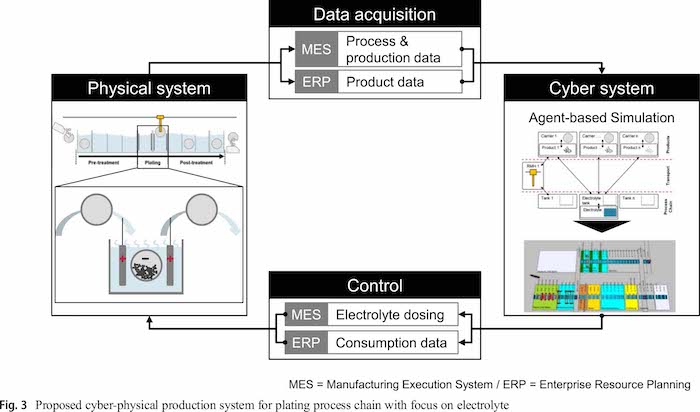
A CPPS approach for the plating process chain focusing on the electrolyte builds the methodological framework (see Fig. 3). It contains the four typical elements physical system, data acquisition, cyber system and decision support [30, 31]. The integration of the simulation models in a CPPS approach allows to use the simulation data for a predictive electrolyte control system. The approach shall work without further analytical measurement or sensor data and uses available data from the manufacturing execution system (MES) and the enterprise resource planning system (ERP).
In contrast to the CPPS from Leiden and colleagues [32], this approach focuses on the electrolyte and the direct influences from the whole plating process chain. The physical system contains the plating system including all energy and resource flows into and from this system. Process and production data can be obtained automatically from the manufacturing execution system (MES) and product data from the enterprise resource planning system (ERP). However, also, a manual parameterization of the cyber system is possible for the comparison of simulation runs. The cyber system contains the agent based simulation of the whole plating process chain while only the electrolytes are modelled in detail. Based on the automatically acquired data, the behavior of the electrolyte can be estimated a priori. The results of the simulation can be used to control the electrolyte dosing and report resource consumption data to the ERP to reorder additives demand-oriented.
3.1 Physical system
The physical system is given by the plating process chain with a focus on the electroplating process. In industrial electroplating lines, the plating tanks are typically aligned in rows [33]. Barrel, rack and continuous plating are the most important industrial processes [6]. This approach focuses on barrel plating for bulk material as the carryover is comparably high and highly depend on the products properties.
The electroplating process chain generally consists of a pre-treatments, the plating process itself and post-treatment processes. Examples for pre-treatment processes are cleaning, degreasing and pickling as well as an example for a posttreatment process is the passivation [6]. Between single process steps, typically rinsing processes are installed to prevent the carryover between active tanks.
3.2 Data acquisition
The simulation requires process, production and product data which are typically available in the MES and ERP system.
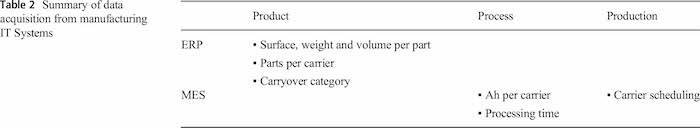
The classification of the drag-out can be included in a new product variable in the ERP system at the first creation of the new product in the ERP. For the data exchange to the simulation text-based interfaces were selected as most MES and ERP systems can address them. Table 2 summarizes the required information for the CPPS approach.
A major advantage of the proposed approach in contrary to other CPPS is that no additional sensors or other measurements systems are required for the data acquisition. This allows a realization at very low investment and operation cost. Further no production stops are required to install new hardware.
3.3 Cyber system
To build the cyber system, an agent simulation-based approach is suggested. The simulation approach bases on a adapted version of the simulation from Leiden and colleagues [32]. The simulation has been realized in the software AnyLogic, a java-based multi-method simulation environment. Agents/sub-models can be realized as classes representing the carrier with products, the rail mounted hoists and the tanks with the electrolyte.
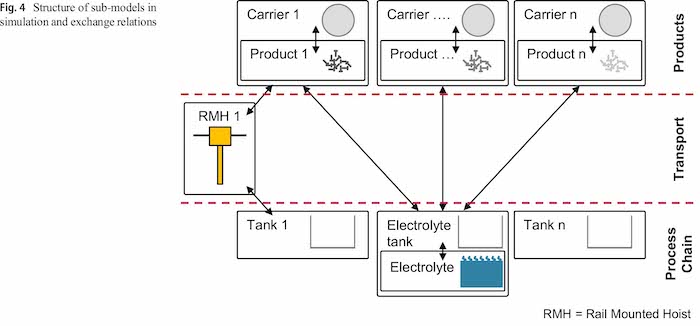
The structure of the simulation can be obtained from Fig. 4. Carriers take a defined number of products and guide them through the plating line. The RMHs transport the carriers with products to different tanks. The tank with the electrolyte also contains the agent electrolyte and can be used for multiple tanks. In the following chapters, the agent types are explained more detailed with the most important variables, states and functions.
3.3.1 Carrier with products
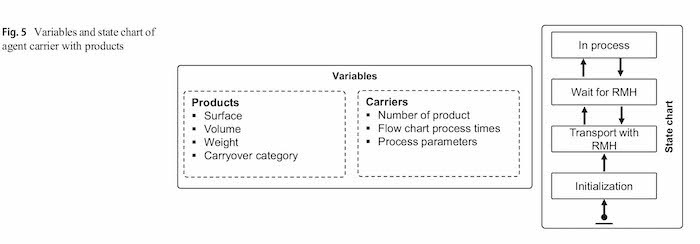
The agent carrier contains a defined number of products and represents the barrels or racks in the plating process. A state-chart is used to control the carriers operation in the process. The states and the transitions between the states are used as discrete events to trigger activities with other agents off. Figure 5 shows a simplified version of this state-chart as well as the variables of the agent. Product-specific variables as the surface, volume or the carryover category as well as carrier-specific variables are stored here and handed over to the tanks with the electrolyte.
3.3.2 Rail mounted hoists
The RMH agent transports the carriers with products through the plating process chain. Solvers for the hoist scheduling problems (HSP) from operations research optimize the utilization of the electroplating line and schedule the operations of the hoist in the MES [34]. To import the activities of the hoist, an interface to the MES has been implemented. This allows importing the batch and tank order. In the simulation, a state-chart oriented model represents the whole transport process from the barrel pick-up, transport to the next tank and drop offs in the next tank. Further algorithms in the simulations ensure that the RMHs do not collide with other RMHs in the plating process chain. This is required as not the movements of the hoist and the barrels are imported. This approach gives a higher degree of freedom in the simulation runs. A direct interface to the HSP solver also is available but has not been used for this approach.
3.3.3 Tanks with electrolyte
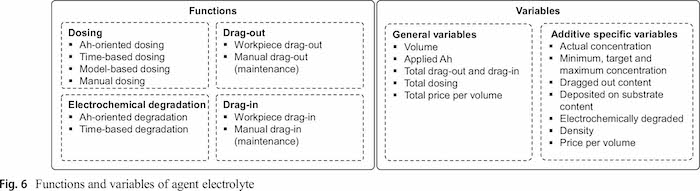
The tank agent represents the physical tank and a slot for processing operations. As the focus of this approach is the electrolyte, this agent mainly serves as place holder for other processes and position for the RMHs. The tanks for electroplating are connected to the electrolyte agent, which is the focus of this approach and presented in Sect. 4. The electrolyte agent contains a number of functions for dosing additives, representing the electrochemical degradation process as well as the drag-out and drag-in processes (Fig. 6). The variables can be split into general variables, which represent the whole electrolyte, and specific variables for each additive.
3.4 Control
The simulation results can be used to control the dosing of electrolyte additives. For this, the simulation from the cyber system reports the amount of required additives volumes via the MES to the additives dosing pumps or the machine operators are instructed to add a defined additive volume to the electrolyte.
The simulation allows a very detailed and seamless monitoring of the electrolyte and also can be used for a priori demand estimation. The future additive demand can be calculated a priori, and additives can be ordered depending on the expected demand. By this, the stored quantities can be reduced which decreases the required storage space on the shop floor and the risks from storing large quantities of hazardous chemicals.
4 Electrolyte model
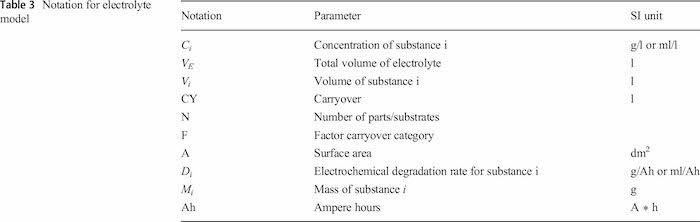
A mathematical model is required to describe the current state of the electrolyte. As already described before an electrolyte is a composition of various ingredients which are decomposed, deposited and dragged out. Figure 7 gives an overview over the processes in an electrolyte and gives examples for control variables. All these processes are explained in this chapter, sorted by the index number from Fig. 7.
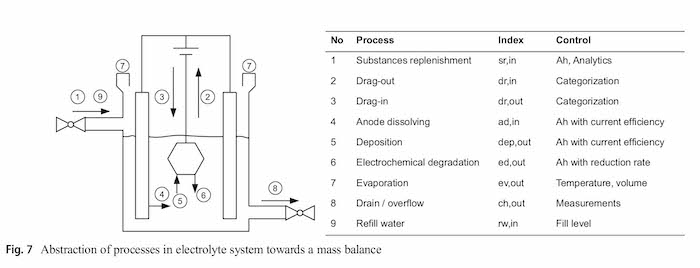
Modelling the concentration of the electrolyte substances enables a live monitoring of the electrolytes substances. The following equation describes the total mass balance of the electrolyte condition with all balance quantities as shown in Fig. 7 (notations can be found in Table 3).
sr; in + dr; in + ad; in + rw; in
= dr; out + dep; out + ed; out + ev; out + ch; out
As shown in Sect. 2, there is a data gap, especially with regard to organic additives. This gap shall be closed with the simulation-based approach presented in this work. Since the organic additives are not consumed by the anode dissolving (Sect. 4), the anode dissolving is not considered further. The possible consumption due to incorporation in the layer (Sect. 5) is covered by the ampere hour-based electrochemical degradation (Sect. 6) consumption. This keeps the simulation approach as simple as possible (Table 3).
4.1 Substances replenishment (1)
During the operation of the plating process, various substances are added, depending on the control variable. The added substance enhances the electrolyte volume by the volume of the substance i: VE, new = VE, before + Vi
The new concentration of the substance i can be calculated by:

It has to be noted that substance concentrations of all substances must be recalculated as the electrolyte volume has been changed.
4.2 Drag-out (2)
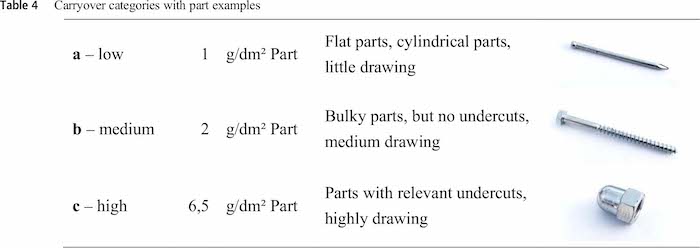
Various models to calculate the carryover from plating baths and other contexts are available [28]. For example Kushner [35, 36], Unruh [37] and Winkler [38] described approaches specifically for plating baths. Petuelli [39] described a similar approach, but in the context of cutting fluid drag out from machine tools. In any way these approaches need a detailed look to every part plated in one specific plating line, which is a difficult task because usually in most of the plating lines several hundreds of different parts are plated. For this study, a simplified approach has been developed as the carryover calculation must be done with available product data from the ERP system. With a part categorization approach the carryover per carrier can be calculated:
![]()
Experimental investigations led to three carryover categories which can be obtained from Table 4. Examples for parts from category a are nails or disks and from category b are screws and open nuts. Category c describes parts with a high carryover behavior such as cap nuts, U-shapes pipes or other parts with relevant undercuts.
The drag-out has not a direct influence on the concentration of substances in the electrolyte, but it determines how much water is added by the next drag-in. Therefore, it is the basis for the following drag-in calculations.
4.3 Drag-in (3)
The drag-in brings water from the last rinsing cascade step to the electrolyte. It has been assumed that the whole liquid film from the carrier and the products is dissolved in the new plating bath. Due to the previous rinsing cascade it is assumed that no other chemicals which could influence the electrolyte are dragged in. The effect of the drag-in can be described by the following formula:

4.4 Electrochemical degradation (6)
Particular ingredients are electrochemically degraded during the plating process. The corresponding electrochemical reactions take place as oxidation reactions at the anodes or as reduction reactions at the surface of the cathode, which means the parts to be plated. In this specific case, the electrochemical degradation can be described only by a specific degradation rate Di:
![]()
4.5 Evaporation (7)
Evaporation describes the change from the liquid to the gaseous state phase with temperatures significantly below the boiling point. In the German VDI standard 2089 Part 1, a calculation process for the evaporation of swimming pools can be found [40]. As this bases on physical variables which are the same for plating tanks this approach is applicable. An empirical approach is available from Mazurczak [41]. He described the evaporation of aqueous solutions depending on the liquid temperature and the air speed above the liquid surface under the assumption that the air temperature is constant between 15 and 25 °C, the air humidity between 70 and 90% and under atmospheric pressure.
For this approach, it has been assumed that the evaporation (7) is relatively low and evaporation losses are replenished with fresh water by a level sensor. Further only water evaporates and no further ingredients. Therefore, the evaporation has no direct influence on the calculation of the ingredients concentrations.
4.6 Drain / overflow (8)
Especially for maintenance purposes, it can be necessary to remove electrolyte from the tank. This results in a reduced electrolyte volume, V, but has no influence on the concentrations of the substances. Usually, a drain or an overflow requires a substances replenishment to keep the electrolyte volume. Replenishing substances will have an impact on the concentrations of the electrolyte.
5 Case study and model validation
The case study and model validation was done in a SME job plating company running an electroplating service facility for various metal coatings. At this facility, a fully automated acid zinc–nickel barrel plating process chain with pre-and posttreatment processes has been selected. The plating line is operated 24 h in three shifts. Most products in this process chain are for the automotive industry and are small to medium sized, so that barrel plating is the most economically reasonable electroplating method. The electrolyte has a total volume of 5,500 l and six plating stations for barrels separated in two connected tanks (Fig. 8). A circulation pump ensures the uniform electrolyte substances distribution at all plating stations. After the electroplating process a rinsing cascade follows.
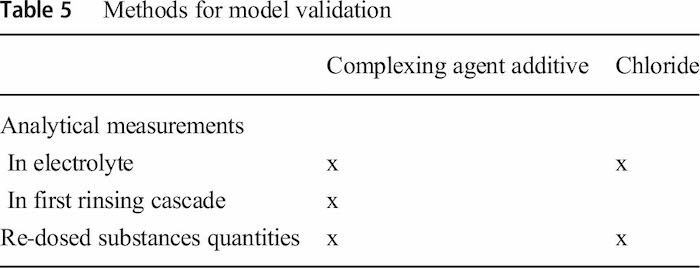
A 4-day and a 30-day validation for two different electrolyte additives with different methods were done (Table 5). For this purpose, the concentrations of individual additives in the electrolyte were estimated analytically in the electrolyte and the first rinsing cascade and compared with the data from the simulation model. The samples for the analytical investigations were taken daily at the beginning of the morning shift and analysed with HPLC by the process supplier for the 4-day verification and with titration in-house for the 30-day verification. These analytical measurements depict only a static snapshot compared with the simulation which allows a seamless estimation of the additive concentration. In addition, the simulation results were compared with the re-dosed electrolyte additives quantities.
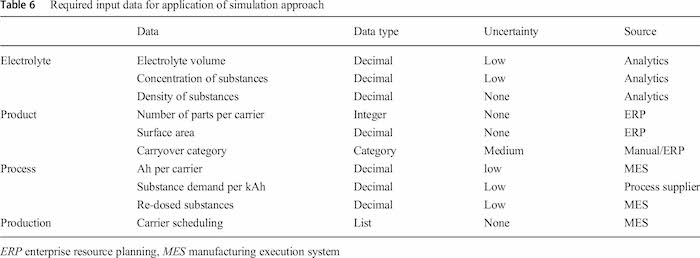
In Table 6 the required input data with data type, degree of uncertainty and source is summarized. As already described the electrolyte data were gathered by analytical measurement. Product, process and production data are taken automatically from the MES and ERP system and imported into the simulations environment. The line operator only had to classify the products manually into the carryover categories as all other relevant parameters are already stored in MES and ERP. However, during the validation the carryover category was implemented in the latest ERP version, so that in future this parameter also can be retrieved automatically).
As signal noise and uncertainties such as outliners can have a significant impact on the simulation results [42–44], the input parameters with the highest degree in variance are secured with an integrated sensitivity analysis. The highest degree of uncertainty can be found at the categorization approach for the carryover category which is a manual process. It bases on the individual decision of the person who classifies the parts with the given instructions. Therefore, the categories were varied in compare simulation runs for validation.
5.1 Validation with complexing agents additive
The industrial acid zinc–nickel electrolyte contains a complexing agent additive. Complexing agents ensure an even alloy distribution over the whole current density range and stabilize the chemical electrolyte system [45]. The exact composition of complexing agent composition is not published by the process supplier; therefore, the analytical investigations only can be conducted in external laboratories by the process supplier.
For the simulated timespan a drag-out of 201 l is calculated by the simulation, which differs only 1% from a calculation based on the measured zinc concentration of the first rinsing cascade after the electroplating process (198 l). The zinc content is constant in the electrolyte, and therefore, it allows calculating the carryover to the first rinsing cascade based on the concentration in the rinsing cascade. For this, the rinsing cascade has been renewed with fresh water at the time of the first analytical measurements and the concentrations were analysed daily to verify the drag-out calculations from the simulation.
During four days, 140 carriers with 1.2 million products of 13 different product types are plated with zinc–nickel coatings. To test the sensitivity of the category selection, in three further scenarios the carryover categories of all parts were set to a, b or c only. Figure 9 shows the impact of different dragout classifications after 4 days. The correct classification of the products has a significant influence on the drag-out. Comparing the results of the lowest and the highest drag-out categories shows a six times higher drag-out for the maximum drag-out category.
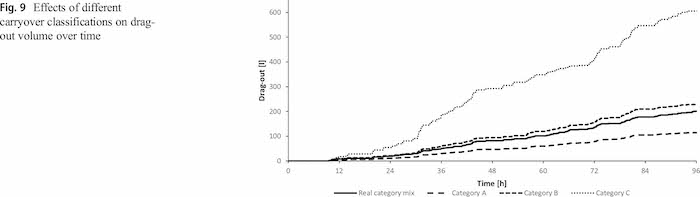
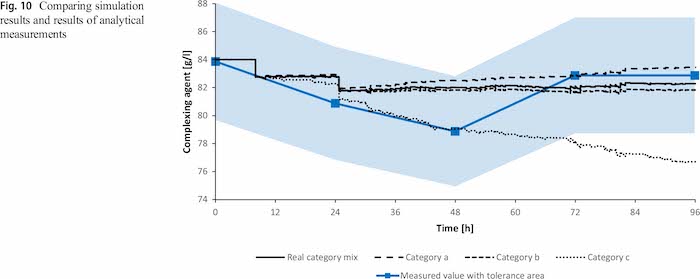
Figure 10 shows the analytically estimated values including the tolerance area of the measurements in combination with the simulated concentration development. The simulated values stay within the tolerance border of the measurements and generally follow the trend of the measurements. However, also in case all parts are in carryover category a or b, the simulated values stay within the tolerance area of the measured values. The classification only fails for using category c for all parts. Therefore it is required to validate the categorization approach also over a longer time span.
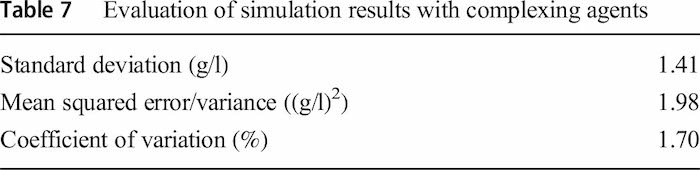
The standard deviation is low with 1.41 g/l as well as the coefficient of variation with 1.7% (Table 7). Selecting dragout category c for all products would result in additive concentration values which are not within the range of the measurement. However, this validation shows that the results of the simulation are reasonable, but a longer analysis is required to test the simulation in the long term.
5.2 Validation with chloride
Chloride is not converted or consumed during the electroplating process and is only carried out. It is an essential part of acidic zinc–nickel electrolytes to ensure a good conductivity. It can be measured manually with titration in the laboratories of the plating company, which allows validating the drag-out simulation without complex analytical measurements methods from external laboratories.
In the course of 30 days 1136 carriers with 11.5 million products of 58 different product types are plated with zinc– nickel coatings. This results in a drag-out of 1800 l of electrolyte, which is equivalent to 32.7% of the total electrolyte volume. Figure 11 shows the simulation as discrete progression during the time of the analytical measurements with and the analytically determined progression of the chloride content of the acidic zinc–nickel electrolyte. The two curves show a similar progression.
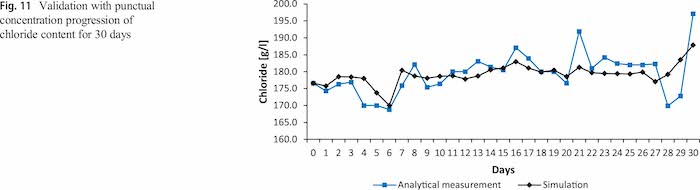
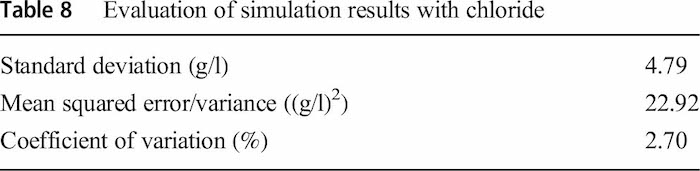
The standard deviation between the simulation and the analytical measurements is 4.7 g/l or 2.7%, and the maximum deviation is 5.8% (Table 8). The highest deviations can be observed in the last four days and are the result of problems in the plating line. These led to electrolyte dumping which could not be quantified for the simulation. At this time also nearly no carrier went through the plating process.
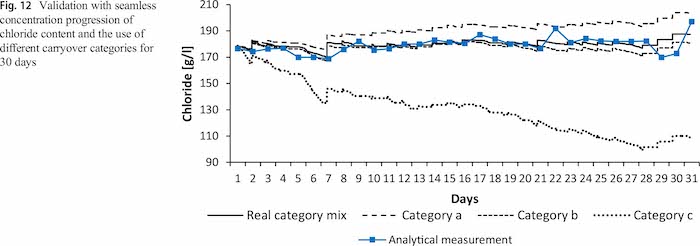
Compared with Fig. 11, which only depicts the simulated results at the time of the analytical measurement, Fig. 12 shows the exact simulated progression of the chloride content. The simulation enables a seamless monitoring of the chloride content and shows small peaks after adding chloride compounds to the electrolyte. It has to be noted that the increase in concentrations after dosing large amounts of chloride compounds arises earlier than in the analytic results. A reason for this could be the dosing of solid chloride compounds, which do not dissolve immediately as assumed in the simulation. Again, as shown for the complexing agent in Figs. 10 and 12 the carryover categories have been varied. Selecting only category a and c results in significant different progressions, while selecting only category b has a similar progression up to day 15 of the simulation. From here, the real category mix is capable to represent the analytically estimated progression better than selecting only category b.
However, the seamless monitoring with the simulation allows to estimate the electrolyte behavior between single measurements, which are only static snapshots. Predicting the additives concentration progression a priori can prevent concentration drops and increase the process stability especially in case the drag-out behavior of to be plated products widely differs. The computing capacity of current standard IT systems is sufficient for a calculation parallel to the operation of the electroplating line.
5.3 Economic and environmental impacts of model based electrolyte control
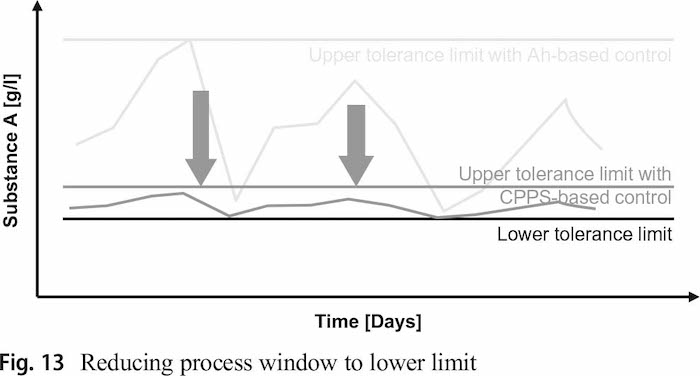
With the newly developed approach it is possible to reduce the size of the process window and move it close to the lower limit as showed in Fig. 13. The continuous monitoring of the electrolyte’s state through the simulation allows a significant more precise dosing as the electrolyte composition is visible at any time. Further, if the simulation is used to predict the future development of the electrolyte composition it is possible to adjust the dosing strategy a priori (e.g. in case of high number of parts with category c). The analytical measurement efforts can be reduced significant, while the only additional effort is the categorization of the parts which can be done in seconds during the first integration of a product in the ERP system.
The additives from the process suppliers are costly and partly hazardous. Reducing the concentration has the potential to decrease the cost and environmental impacts through chemicals as well as for the wastewater treatment. To calculate the financial savings from the proposed approach, it has been assumed that the 4-day simulation is representative for a whole year and it is applied to all electrolyte substances. In the simulation, the current concentrations were multiplied by the chemicals price need to be paid by the operator. The resulting saving through the use of less chemicals would reach 2450 € compared with the target concentration value and 6200 € compared with the minimum concentration value. Due to the more precise process control that can be achieved, the target values can be reduced towards the minimum values. Savings in the range between the mentioned values are easily achievable. Further savings from reduced wastewater treatment cost or less production rejects could be even higher. The estimation of the exact environmental impacts is difficult as the process supplier does not publish the exact ingredients of the additives.
Another advantage of the approach is the low computational burden. As the simulation bases on a material flow simulation model and no numeric solvers are required, it can run on a standard industrial computer. In case of a full integration into the MES and ERP systems, it would be possible to run it parallel to other control algorithms. Especially compared with MES optimization algorithms to solve the HSP should have a significant higher computational burden.”
6 Conclusion and outlook
A mathematical model for modelling the electrolyte has been developed and transferred into a production engineering simulation model of a whole plating line. This simulation has been integrated into the IT environment of manufacturing companies to use the simulation as part of a CPPS. This approach allows using data from an existing electroplating line and uses the simulation results for controlling the electrolyte.
The case study at a job plater for two different electrolyte substances for an acid zinc–nickel electrolyte showed applicability of the proposed model approach. The simulation model can show effects faster than the chemical analytics, since the simulation gives accuracy in the minute range. Through the use of a model-based dosing approach, the target concentration can be decreased to the lower limit and the dosing range can be sized down. This will reduce the amount of required chemicals and decrease the cost for the plating process. Further the quality of the plated surfaces can be increased as the additives can be kept in a smaller range.
In this research work the simulation served as testbed platform for new algorithms in a separate save cyber environment to test various algorithms at comparably low efforts. For a full industrial implementation it would be reasonable to include the verified models directly into the MES or ERP systems. This would allow working without further software tools and increases the performance of the overall manufacturing IT system.
As next step, the approach could be transferred to further electrolyte substances and other electroplating processes. It is important to note that the chemical degradation behavior must be clear for each substance. Especially for most commercially used organic electrolytes substances this data is not available.
Further research could improve the model quality with a machine learning approach, which is supported by sporadic analytical measurements. This would allow also developing black box models for electrolytes, which electrochemical degradation behavior is unclear.
Also, the categorization of the carryover categories could be automated with CAD model. In case CAD models are not available, machine learning algorithms could support the categorization by analyzing available information as name of the part, size or the volume/surface ratio and suggest a category, which should be confirmed by an electroplating line operator.
A limitation that remains is that the simulation cannot serve in case of situations which are not covered by the simulation. Examples for this are the use of unmonitored overflows or not correctly adjusted/working dosing pumps. Therefore, also, in case of a full implementation of the proposed approach, rare accompanying analytical measurements are required to ensure that electrolyte is still in the expected range. In case the simulation is out of the range of the analytical measurement, it can be reset with the results from the analytical measurements.
Authors
Alexander Leiden, Sebastian Thiede, and Christoph Herrmann are with the Institute of Machine Tools and Production Technology, Chair of Sustainable Manufacturing & Life Cycle Engineering, Technische Universität Braunschweig, Langer Kamp 19b, 38106 Braunschweig, Germany.
Stefan Kölle, Klaus Schmid, and Martin Metzner are with the Division Surface Engineering and Materials Technology, Department Electroplating, Fraunhofer-Institute for Manufacturing Engineering and Automation IPA, Nobelstr. 12, 70569 Stuttgart, Germany.
Christoph Herrmann is with the Fraunhofer Institute of Surface Engineering and Thin Films IST, Bienroder Weg 54 E, 38108 Braunschweig, Germany.
Compliance With Ethical Standards
Acknowledgements: The authors thank the project partners for their support especially during validating the simulation result in the case study.
Conflict of interest: The authors declare that they have no conflict of interest.
References
1. Unruh JNM (2017) Lehrbuch der Galvanotechnik: Band I: Allgemeine Galvanotechnik, 1. Auflage edn. Lehrbuchreihe Galvanotechnik, Leuze Verlag, München
2. Tillmann W, Vogli W (2006) Selecting surface-treatment technologies. In: Laarmann A, Bach F-W, Wenz T (eds) Modern surface technology. John Wiley, Weinheim, Chichester
3. Schmid SR, Jeswiet J (2018) Surface treatment and tribological considerations. In: Sutherland JW, Dornfeld DA, Linke BS (eds) Energy Efficient Manufacturing, John Wiley & Sons, Inc, vol 52. Hoboken, NJ, USA, pp 169–195
4. Leiden A, Brand P-J, Cerdas F, Thiede S, Herrmann C (2020) Transferring life cycle engineering to surface engineering. Procedia CIRP 90:557–562. https://doi.org/10.1016/j.procir.2020. 02.132
5. European Comission (2006) Reference document on best available techniques for the surface treatment of metals and plastics. https:// eippcb.jrc.ec.europa.eu/reference/BREF/stm_bref_0806.pdf. Accessed 3 May 2020
6. Olberding W (2006) An introduction to electrodeposition and electroless plating processes. In: Laarmann A, Bach F-W, Wenz T (eds) Modern surface technology. John Wiley, Weinheim, Chichester, pp 101–118
7. Preikschat P, Jansen R (1999) Elektrochemische automatische Prozessregelung für galvanische Elektrolyte. Galvanotechnik 90: 2416–2424
8. Giebler E (2002) Modellbildung und Simulation für die Prozessführung von Verfahrensprozessen der Galvanound nasschemischen Oberflächentechnik. Zugl.: Dresden, Techn. Univ., Diss., 2002, Als Ms. gedr. Fortschritt-Berichte VDI Reihe 8, Meß-, Steuerungsund Regelungstechnik, vol 952. VDI-Verl., Düsseldorf
9. Acactech National Academy of Science and Engineering (2013) Recommendations for implementing the strategic initiative INDUSTRIE 4.0. https://en.acatech.de/wp-content/uploads/sites/6/ 2018/03/Final_report__Industrie_4.0_accessible.pdf. Accessed 3 May 2020
10. Bundesministerium für Bildung und Forschung (2019) Industrie 4.0. https://www.bmbf.de/de/zukunftsprojekt-industrie-4-0-848. html. Accessed 3 May 2020
11. Herrmann C, Schmidt C, Kurle D, Blume S, Thiede S (2014) Sustainability in manufacturing and factories of the future. Int J of Precis Eng and Manuf.-Green Tech 1:283–292. https://doi.org/10. 1007/s40684-014-0034-z
12. Blittersdorf R, Tubbesing U (2007) Prozessbegleitende Analytik bei der Zink-Nickel-Legierungsabscheidung. Galvanotechnik 98
13. Moosbach E (2014) Vorteile und Grenzen einfacher Messverfahren im Betriebslabor einer Lohngalvanik im Edelmetallbereich. Galvanotechnik 105:680–682
14. Yli-Pentti A (2014) 4.11 Electroplating and electroless plating. In: Hashmi S (ed) Comprehensive materials processing. Elsevier, Oxford, pp 277–306
15. Kölle S, Schmid K, Mock C et al. (2019) Elektrolytführung neu gedacht. WOMag
16. Reger H, Maser N (2003) Neues Gerätekonzept für eine computerbasierte analytische (offund online) Überwachung von galvanischen Elektrolyten. Galvanotechnik:83–86
17. Andrle C, Jelinek TW (2007) Hull-Zelle zur Untersuchung von galvanischen Elektrolyten, 1. Auflage. Schriftenreihe Galvanotechnik und Oberflächenbehandlung, vol 38. Leuze, Bad Saulgau
18. Jelinek TW (2013) Praktische Galvanotechnik: Ein Lehrund Handbuch ; 96 Tabellen im Text, einem speziellen TabellenAnhang und einer Übersicht "Chemikalien für die Galvanotechnik", 7th edn. Lehrbuchreihe Galvanotechnik. Leuze, Bad Saulgau
19. Verein Deutscher Ingenieure (2014) Simulation of systems in materials handling, logistic and production(3633 Part 1)
20. Rose O, März L (2011) Simulation. In: März L, Krug W, Rose O et al (eds) Simulation und Optimierung in Produktion und Logistik. Springer, Berlin Heidelberg, Berlin, Heidelberg
21. Borshchev A, Filippov A (2004) From system dynamics and discrete event to practical agent based modeling: reasons, techniques, tools. Proceedings of the 22nd International Conference of the System Dynamics Society
22. Montanari R, Varone A (2019) Processing–structure–property relationships in metals. Metals 9: 907. https://doi.org/10.3390/ met9080907, Processing–Structure–Property Relationships in Metals
23. Birosca S (ed) (2017) Process-structure-property relationships in metals. MDPI AG Multidisciplinary Digital Publishing Institute, Basel
24. YanW,LinS,KafkaOL,LianY,YuC,LiuZ,YanJ,WolffS,Wu H, Ndip-Agbor E, Mozaffar M, Ehmann K, Cao J, Wagner GJ, Liu WK (2018) Data-driven multi-scale multi-physics models to derive process–structure–property relationships for additive manufacturing. Comput Mech 61:521–541. https://doi.org/10.1007/s00466018-1539-z
25. Schulz H, Quinto DT (1990) Technological development of PVD hard coatings for industry. Zeitschrift für Metallkunde 90:831–836 26. Schuhmacher B, Schwerdt C, Seyfert U, Zimmer O (2003) Innovative steel strip coatings by means of PVD in a continuous pilot line: process technology and coating development. Surface and Coatings Technology 163-164:703–709. https://doi.org/10. 1016/S0257-8972(02)00660-6
27. European Chemicals Agency (2019) Substance information: chromium trioxide. http://echa.europa.eu/de/substance-information/-/ substanceinfo/100.014.189. Accessed 3 May 2020
28. Nagel C (2000) Stoffstromorientierte Entscheidungen für Materialfluß und Produktion in galvanotechnischen Anlagen. Logistik für die Praxis, Verlag Praxiswissen, Dortmund
29. Xu Q, Telukdarie A, Lou HH, Huang Y (2005) Integrated electroplating system modeling and simulation for near zero discharge of chemicals and metals. Ind Eng Chem Res 44:2156–2164. https://doi.org/10.1021/ie0495067
30. Thiede S, Juraschek M, Herrmann C (2016) Implementing cyberphysical production systems in learning factories. Procedia CIRP 54:7–12. https://doi.org/10.1016/j.procir.2016.04.098
31. Thiede S (2018) Environmental sustainability of cyber physical production systems. Procedia CIRP 69:644–649. https://doi.org/ 10.1016/j.procir.2017.11.124
32. Leiden A, Thiede S, Herrmann C (2019) Agent-based simulation for multi-criterial planning and control of automated electroplating lines. In: Putz M, Schlegel A (eds) ASIM 2019: Simulation in Produktion und Logistik, 1st edn. Wissenschaftliche Scripten, Auerbach, pp 111–120
33. Müller K-P (2003) Praktische Oberflächentechnik: Vorbehandeln, Beschichten, Beschichtungsfehler, Umweltschutz, 4.th edn. Vieweg Verlag, Braunschweig, Wiesbaden
34. Manier M-A (2003) A classification for hoist scheduling problems. International Journal of Flexible Manufacturing Systems 15:37–55. https://doi.org/10.1023/A:1023952906934
35. Kushner J-B (1951) Dragout Control Part I. Metal Finishing
36. Kushner J-B (1951) Dragout Control Part II. Metal Finishing
37. Unruh JNM (1991) Optimierung von Ausschleppund Spülprozessen. Metalloberfläche 45
38. Winkler L (85) Spülen Qualitätssicherung und Umweltschutz (Teil 4): Modifikation des Basisspülmodells Kaskadenspültechnik. Galvanotechnik 1994 Int J Adv Manuf Technol (2020) 111:1751–1766
39. Petuelli G (2002) Simulation des Kühlschmierstoffkreislaufs zur Optimierung einer umweltund ressourcenschonenden Produktionstechnik. Berichte des Wrangell-Instituts für Umweltgerechte Produktionsautomatisierung, vol 8. Shaker Verlag, Aachen
40. DIN Deutsches Institut für Normung e.V. (2010) Technische Gebäudeausrüstung von Schwimmbädern(2089 Blatt 1)
41. Mazurczak G, Schauer W, Frischmann K (1990) Beheizen und Kühlen von mäßrigen Lösungen in der Ätz-, Beizund Galvanotechnik, Teil 1. Metalloberfläche 44
42. Aggarwal CC (2017) Outlier Analysis, 2nd ed. 2017. Springer International Publishing, Cham, s.l.
43. Stojanovic V, Prsic D (2020) Robust identification for fault detection in the presence of non-Gaussian noises: application to hydraulic servo drives. Nonlinear Dynamics, 100(3), 2299-2313. Nonlinear Dyn 100:2299–2313. https://doi.org/10.1007/S11071020-05616-4
44. Stojanovic V, He S, Zhang B (2020) State and parameter joint estimation of linear stochastic systems in presence of faults and non-Gaussian noises. International Journal of Robust and Nonlinear Control. Int J Robust Nonlinear Control. https://doi.org/ 10.1002/RNC.5131
45. Schlötter Galvanotechnik (2011) Zink-Nickel Legierungbad SLOTOLOY ZN 320