The aim of the present work was to study the effect of graphene oxide as an additive in the anodization bath of the ZK60A magnesium alloy on the corrosion resistance, film morphology and surface chemical composition.
The anodizing process was conducted at a constant current density of 30 mA.cm−2 in an electrolyte consisting of 3 M de KOH, 0.15 M de Na2SiO3 and 0.1 M Na2B4O7.10H2O. Graphene oxide was added to this bath at three different concentrations: 0.5 g.L−1, 1.0 g.L−1 and 3.0 g.L−1. The ability of the graphene oxside nanofiller to enhance the corrosion resistance of the ZK60A alloy was evaluated by electrochemical impedance spectroscopy and potentiodynamic polarization tests in 3.5 wt.% NaCl solution.
The surface chemical composition was assessed by X-ray photoelectron spectroscopy (XPS). Scanning electron microscopy (SEM) coupled with EDS analysis was employed to examine the anodized layer morphology and thickness. The results pointed to a beneficial effect of graphene oxide addition on the corrosion resistance of the anodized ZK60A which was dependent on the concentration of the nanofiller in the anodizing electrolyte.
1. Introduction
 Authors, from top, Paula Lima Braga, Denise Criado Pereira de Souza, Mara Cristina Lopes de Oliveira, and Renato Altobelli Antunes.Magnesium alloys are increasingly attracting attention as structural materials in the transportation industry, especially for automotive and aircraft applications due to their high strength-to-weight ratio [1,2,3]. The ZK60A alloy belongs to the ZK series for which zinc and zirconium are the main alloying elements. It exhibits a good set of mechanical properties, mainly due to the grain refinement effect of zirconium in conjunction with solid solution strengthening and precipitation hardening due to the presence of zinc-rich precipitates [4,5].
One major concern in consolidating and expanding the engineering applications of magnesium alloys is their well-known high electrochemical activity, which makes them prone to corrosion in chloride-containing environments [6,7]. The ZK60A alloy has been shown to be susceptible to corrosion attack in sodium chloride solutions. For example, Li et al. [8] studied the effect of microstructure on the corrosion resistance of a commercial ZK60 alloy in 0.1 mol.L−1 NaCl solution at room temperature. A strong micro-galvanic effect was observed between the Mg-α and MgZn2 second-phase particles precipitated at grain boundaries. Baek et al. [9] have also observed that intermetallic particles played a major role in the corrosion behavior of the ZK60 alloy in sodium chloride solution due to microgalvanic effects between the anodic Mg-α matrix and precipitates containing zinc and zirconium.
In light of the examples depicted in the previous paragraph, intense research activity has been dedicated to improving the corrosion resistance of magnesium alloys. Several different methods have been reported based on microstructural control by proper heat treatments [10,11], deformation processes [12] and surface modification techniques, such as ion implantation [13], plasma electrolytic oxidation (PEO) [14,15], electrodeposition [16] and anodization [17]. Anodization is a common protective method for enhancing the corrosion properties of magnesium alloys. The process is based on the electrolytic anodic oxidation of the metallic surface, converting it into an oxide layer in an electrolyte with controlled composition [18,19,20]. Species from the electrolyte are incorporated into the anodized layer, providing it with functional properties [21,22]. Silicate-based electrolytes have been extensively employed as environmentally friendly solutions to conduct the anodizing of magnesium alloys, giving satisfactory corrosion protection to the underlying substrate. As previously reported [23], silicate may enhance the compactness and increase the thickness of the anodized film, thus improving its corrosion protection ability.
Due to the inherent porous structure of anodic films grown during anodization, several researchers have developed electrolytic baths containing inorganic nanoparticles as a strategy to enhance the barrier properties of the anodized layer [24,25,26]. For instance, Zhang et al. [27] observed that the corrosion resistance of an anodized AZ31 magnesium alloy was improved when Al2O3 nanoparticles were added to the anodizing electrolyte due to the enhanced compactness of the anodic film. Similarly to oxide nanoparticles, graphene and its derivatives may have a beneficial influence on the corrosion protection ability of either organic or inorganic coatings [28]. Such a positive effect is mainly due to an enhanced barrier effect as the presence of the graphene-based nanoparticles increases the diffusion path of corrosive species in the electrolyte [29,30]. Graphene oxide (GO) plays a central role in this scenario [31].
Among graphene derivatives, graphene oxide is often reported as having superior corrosion resistance either when used directly as a coating layer or as an additive to improve the barrier properties of organic and inorganic films [32,33,34]. Zhao et al. [35] employed GO as an additive in the electrolyte of a PEO-treated AZ31 magnesium alloy. They observed that, depending on the concentration of GO in the electrolyte, the corrosion resistance was increased due to the pore-blocking effect of GO particles.
While some reports can be found with regard to the use of GO as an additive for improving the corrosion protection ability of anodic oxide films obtained on magnesium alloys, this information is scarce if one considers the anodization process of the ZK60 alloy. Furthermore, the correlation between corrosion resistance and the surface chemistry of the GO-doped anodized layer is not reported in the current literature. The aim of the present work is to fill this gap by evaluating the effect of GO as an additive in the anodizing bath of the ZK60A alloy on the corrosion resistance, surface chemistry and film morphology. The anodizing bath consisted of an alkaline electrolyte containing sodium silicate. The correlation between corrosion resistance in sodium chloride solution, the surface chemistry of the anodized layer and its morphology is discussed.
2. Materials and Methods
2.1. Materials, Sample Preparation and Anodization
The substrate material used in the present work was an extruded bar (diameter of 90 mm) of the ZK60A alloy (nominal chemical composition in wt.%: Zn 4.8–6.2; Zr ≥ 0.45; Mg Balance), supplied by Xi’an Yuechen Metal Products Co. Ltd. (Xi’an, China). Initially, circular disks with a thickness of 3 mm were cut from the original bar using a cut-off instrument equipped with silicon carbide blades and water-refrigerated. Next, rectangular specimens were cut from these disks with dimensions of 10 mm × 10 mm × 3 mm.
The graphene oxide was a commercial product (UFMG, Belo Horizonte, Brazil) in the form of an aqueous suspension with a nominal concentration of 5 g.L−1. All chemicals used in the anodizing process were reagent-grade products. The specimens for anodizing were ground with silicon carbide waterproof papers up to grit 2000, followed by polishing with 0.5 µm alumina suspension.
The composition of the anodizing electrolyte consisted of a mixture of 3 M KOH, 0.15 M Na2SiO3 and 0.1 M de Na2B4O7.10H2O (pH = 13.5) with additions of three different concentrations of graphene oxide: 0.5 g.L−1, 1.0 g.L−1 and 3.0 g.L−1. The process was conducted using a D.C. power supply (MP5003D, Shenzen, China) for 30 min at a constant current density of 30 mA.cm−2, under magnetic stirring. A stainless steel vessel was used as the cathode. After anodizing, the specimens were washed with deionized water and dried in a warm air stream with a heat gun.
Samples designation throughout the text is as follows: 0-GO (anodized in the electrolyte without GO addition); 0.5-GO, 1.0-GO and 3.0 GO (samples anodized in the electrolytes with additions of 0.5 g.L−1, 1.0 g.L−1 and 3.0 g.L−1, respectively).
2.2. Characterization
2.2.1. Microstructural and Topographic Aspects
Surface and cross-sectional examination of the anodized samples were carried out by scanning electron microscopy (SEM, Leica, LEO 440i, Wetzlar, Germany). For surface topography examination, the micrographs were acquired in the secondary electrons mode (SEM-SE). For atomic number contrast, the images were obtained in the backscattered electrons mode (SEM-BSE). In the latter case, EDS (energy dispersive X-ray spectroscopy) analyses were carried out to map the elemental distribution on the surface of the samples. Surface roughness was measured by confocal laser scanning microscopy (Olympus Lext, OLS 4100, Waltham, MA, USA) in a non-contact mode. The roughness values are expressed as Ra (average roughness) and were obtained from an average value of 10 measurements.
2.2.2. Raman Spectroscopy and X-ray Photoelectron Spectroscopy (XPS)
Raman spectroscopy analysis (Horiba Scientific, T64000 dispersive Raman, Kyoto, Japan), equipped with a laser excitation source of a wavelength of 532 nm was employed to characterize the main structural aspects of the graphene oxide particles. Sample preparation consisted of dispersing a droplet of the as-received graphene oxide aqueous suspension on a glass plate and letting it dry overnight. After complete drying, the remaining graphene oxide particles were analyzed in the Raman spectrometer.
XPS analysis of the anodized layers was carried out to assess their surface chemical states. A ThermoFisher Scientific spectrometer (K-alpha, Waltham, MA, USA) was used, operating with an Al-kα radiation source (1486.6 eV) with a spot size of 400 µm and vacuum pressure of 10−7 Pa in the analysis chamber. Pass energies were 200 eV and 50 eV for the wide and narrow scan spectra, respectively. Peak fitting was carried out using the Smart algorithm for background subtraction in the Avantage 5.976 software, considering a mixture of Lorentzian and Gaussian functions (70/30).
2.2.3. Electrochemical Tests
As-received and anodized (with and without graphene oxide addition) ZK60A samples were subjected to electrochemical characterization using a conventional three-electrode cell setup. Autolab M101 potentiostat/galvanostat was employed for all measurements. The ZK60A samples were the working electrodes, a platinum wire was used as the auxiliary electrode and Ag/AgCl (KCl, 3 M) was the reference electrode. The electrolyte consisted of a 3.5 wt.% NaCl solution at room temperature. This electrolyte was chosen to assess the general corrosion properties of the different samples with regard to their potential engineering applications as structural materials, allowing their comparison with other published reports in the literature.
Initially, the open circuit potential (OCP) was monitored for 1 h. Next, electrochemical impedance spectroscopy (EIS) measurements were conducted at the OCP in the frequency range of 100 kHz to 10 mHz with an amplitude of the sinusoidal potential signal of ±10 mV (rms), and acquisition rate of 10 points per frequency decade. Potentiodynamic polarization tests were carried out right after the EIS measurements in the potential range of −300 mV versus the OCP up to −1.0 VAg/AgCl. The tests were conducted in triplicate.
3. Results and Discussion
3.1. Morphological and Topographic Aspects
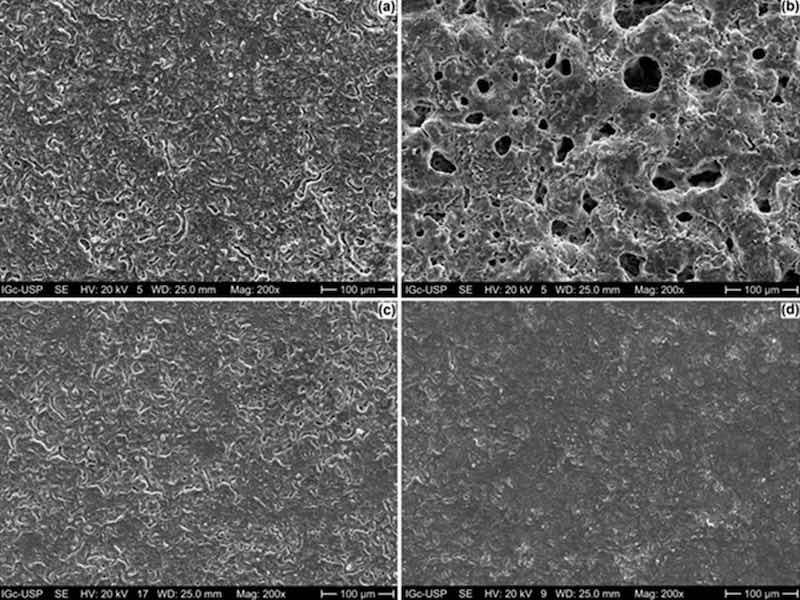
SEM micrographs (secondary electrons mode) of the top surfaces of the anodized ZK60A alloy with and without the addition of graphene oxide are shown in Figure 1. The anodized layer without the incorporation of GO (Figure 1a) displays a flat surface, permeated by microcracks and pores with small diameters that can be more easily observed in the SEM-BSE micrographs (backscattered electrons mode) shown in Figure S1a (Supplementary Files). By adding 0.5 g.L−1 of GO to the anodizing electrolyte, the number of pores in the anodic film was greatly increased, as well as the pore diameter, as seen in Figure 1b and Figure S1b (0.5-GO). When the GO concentration was increased to 1.0 g.L−1 (Figure 1c and Figure S1c) and 3.0 g.L−1 (Figure 1d and Figure S1d), the surface morphology was remarkably affected, exhibiting a more compact character when compared to the sample obtained in the anodizing bath with the lowest GO concentration.
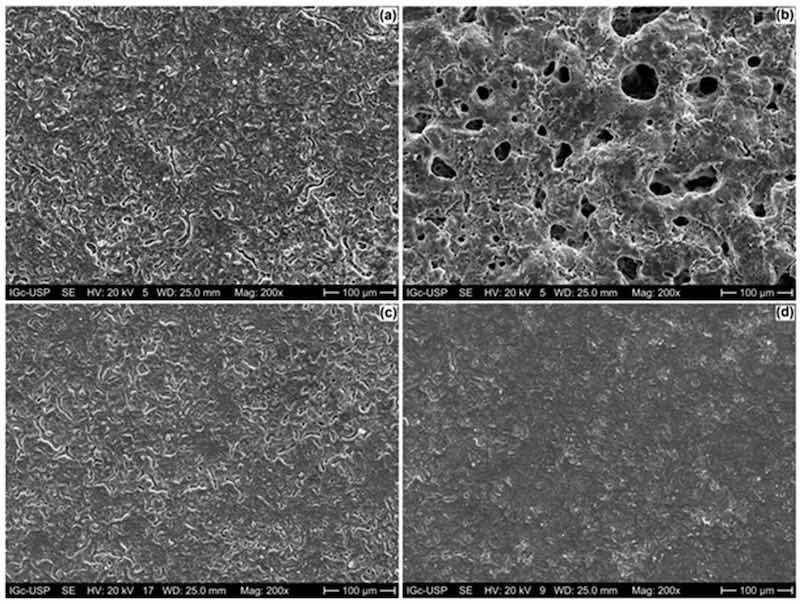
Figure 1. SEM micrographs (secondary electrons mode) of the anodized ZK60A alloy: (a) 0-GO; (b) 0.5-GO; (c) 1.0-GO; (d) 3.0-GO.
Elemental analysis for the 0-GO sample (anodized ZK60A without GO addition) was conducted over the surface displayed in the SEM-BSE image in Figure 2a. The distribution of the main constituents of the ZK60A substrate (Mg, Zn and Zr) and the anodized layer (Mg and Si) was examined by EDS mapping. Magnesium is distributed over the whole surface, as part of the anodized layer. The main alloying elements of the ZK60A alloy, Zn and Zr, displayed weak signals, confirming the good coverage of the underlying surface by the anodic film. The silicon signal is also detected. In fact, for sodium silicate-containing electrolytes, silicon-based species may be part of the anodic film, such as Mg2SiO4, as reported in the literature [36,37].
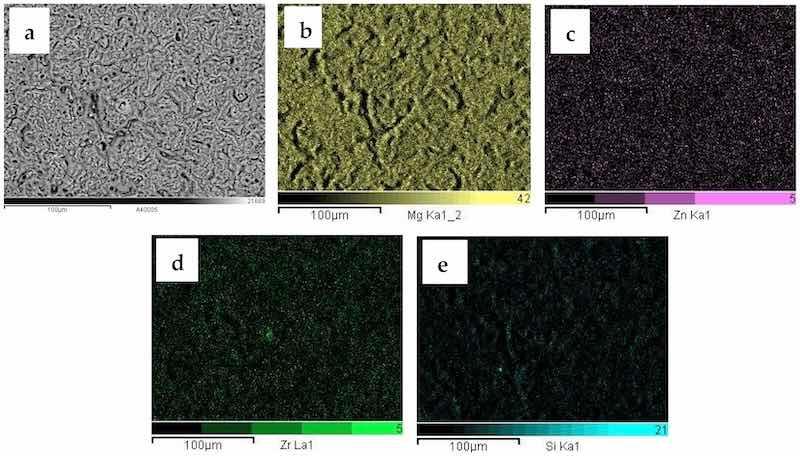
Figure 2. SEM-BSE micrograph (a) and corresponding EDS maps of the 0-GO sample: (b) Mg, (c) Zn, (d) Zr; (e) Si.
The EDS maps of the 3.0-GO sample are displayed in Figure 3. The SEM-BSE micrographs (Figure 3a) reveal its more compact surface when compared to the sample obtained in the electrolyte without GO addition (Figure 2a). EDS maps gave similar information with respect to those found in Figure 2. Magnesium is spread over the whole surface, whereas Zn and Zr (signals from the ZK60A substrate) can be barely seen. Additionally, the Si map (Figure 3e) confirms the incorporation of silicon species from the anodizing electrolyte. The maps obtained for the 0.5 GO and 1.0 GO present similar features and are available as Supplementary Materials (Figures S2 and S3, respectively).
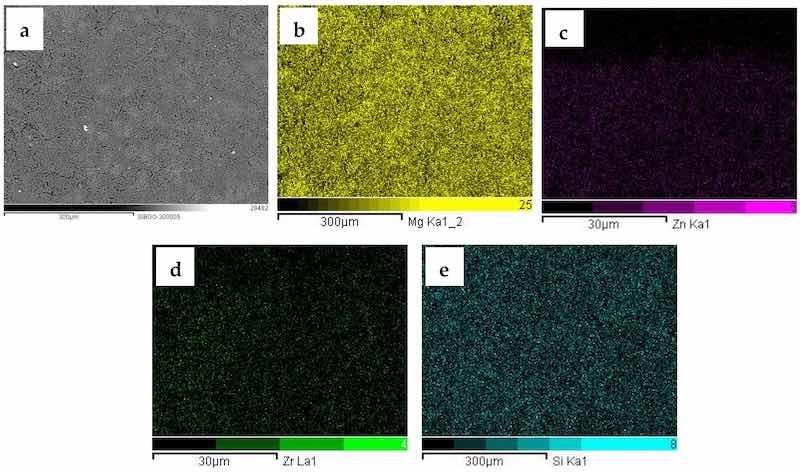
Figure 3. SEM-BSE micrograph (a) and corresponding EDS maps of the 3.0-GO sample: (b) Mg, (c) Zn, (d) Zr; (e) Si.
The morphological aspects of the anodized layers were further examined by SEM-BSE micrographs of the cross-sections. Figure 4 exhibits the SEM-BSE micrograph of the 0-G0 sample and corresponding EDS maps for Mg, O, Zn, Zr and Si. The anodic film is indicated by a white arrow in Figure 4a. It is permeated by pores and cracks, reaching a maximum thickness of approximately 10 µm. The presence of Mg, O and Si is clearly seen in the anodic film.
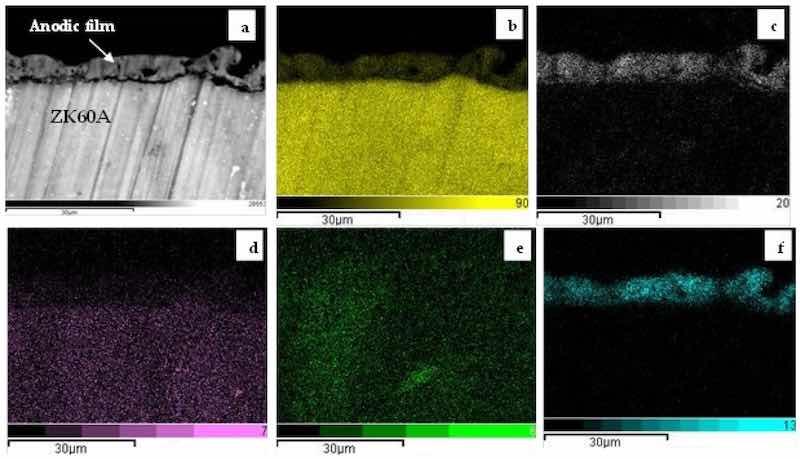
Figure 4. Cross-sectional SEM-BSE micrograph (a) and corresponding EDS maps of the 0-GO sample: (b) Mg, (c) O; (d) Zn, (e) Zr; (f) Si.
A representative EDS mapping of the cross-section of the anodized samples is given in Figure 5 for the 3.0-GO sample. When compared to the 0-GO sample (Figure 4a), the anodic film is much thinner, reaching only 5 µm. Additionally, it is more compact, being permeated by fewer pores and cracks. A possible explanation for the decrease in the anodic layer thickness with increasing GO concentration is related to the agglomeration of GO particles that reduce the growth rate of the anodic film or blocks discharge channels during the anodizing treatment, as suggested by Grigoriev et al. for a PEO/GO composite coating formed on the Ti-6Al-4V alloy [38]. The main elements that constitute the anodic film are also Mg, O and Si. Similar results were observed for the 0.5-GO and 1.0-GO samples with respect to the chemical composition of the anodic film, as shown in the cross-sectional EDS maps displayed in Figures S4 and S5, respectively (Supplementary Materials).
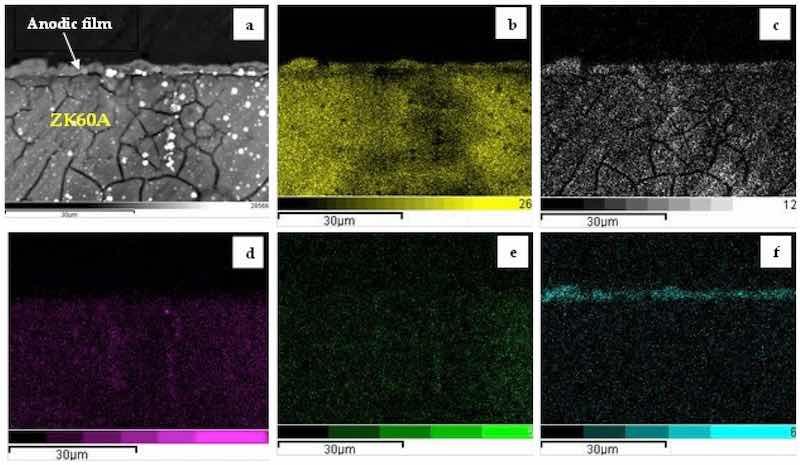
Figure 5. Cross-sectional SEM-BSE micrograph (a) and corresponding EDS maps of the 3.0-GO sample: (b) O, (c) Mg; (d) Zn, (e) Zr; (f) Si.
The roughness values (Ra) of the anodized ZK60A samples were determined using confocal laser scanning microscopy (CLSM), as displayed in Table 1. The polished ZK60A prior to anodizing is also included for comparison. As expected, after anodizing the values of Ra increased with respect to the uncoated substrate. Interestingly, roughness exhibited a remarkable increase for the 0.5-GO sample. As the GO concentration increased, the values of Ra progressively decreased. This is in accordance with the surface aspect observed in the top surface SEM micrographs (Figure 1). This finding may be due to the faster growth rate of the anodic film with low GO concentration, which also makes it thicker, as observed in the SEM micrographs, but more porous and cracked. As the GO concentration increased, and the corresponding growth rate of the anodic film decreased, a thinner and less rough oxide layer was formed.
Table 1. Roughness values (Ra) of the anodized ZK60A samples.
| Sample | Ra (µm) |
| Uncoated ZK60A | 0.58 |
| 0-GO | 1.91 |
| 0.5-GO | 6.10 |
| 1.0-GO | 2.74 |
| 3.0-GO | 0.67 |
3.2. Raman Spectroscopy
The structural characteristics of the graphene oxide particles employed in the present work were obtained by Raman spectroscopy. Figure 6 shows the Raman spectrum of GO. The spectrum is characterized by two distinct bands, D and G bands, that are centered at 1352 cm−1 and 1606 cm−1, respectively, in reasonable agreement with the literature [39].
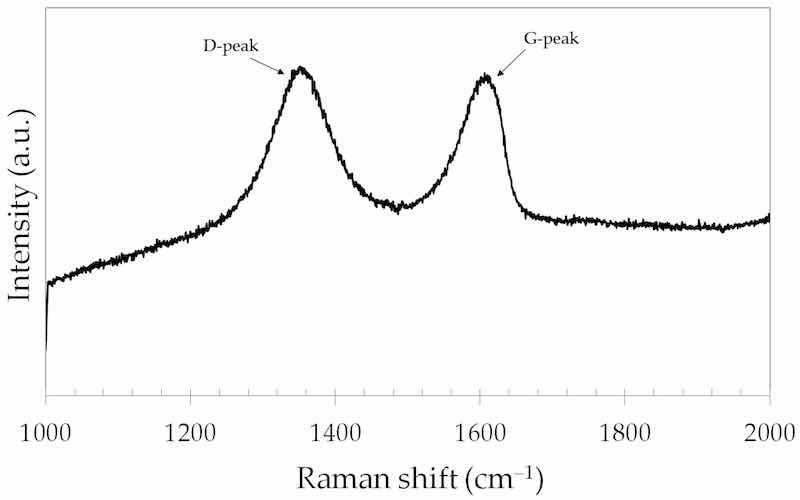
Figure 6. Raman spectrum of the GO particles.
The D band is due to vibrations of sp3 hybridized carbon atoms and the G band is due to in-plane vibrations of sp2 carbon atoms (graphitic carbons) [40]. The D band is associated with defects in the hexagonal carbon lattice with graphitic structure [41]. The ratio (ID/IG) between the intensities of the D (ID) and G (IG) bands is often used as a criterion to evaluate the defective character of graphene and its derivatives [42]. The higher the ID/IG ratio, the more defective the graphene structure. The ID/IG ratio obtained from the spectrum shown in Figure 6 was 1.02, which is typical of GO structure with a low degree of functionalization [43,44].
3.3. X-ray Photoelectron Spectroscopy (XPS)
The GO particles were further characterized by XPS. Figure 7a displays the C 1s narrow scan spectrum of the GO particles. The spectrum was deconvoluted with four components that were assigned to C-C/C=C (284.7 eV), C-O (285.3 eV), C=O (286.4 eV) and O-C=O (288.8 eV) [45,46]. Figure 7b exhibits the O 1s narrow scan spectrum of the GO particles. The spectrum was deconvoluted with three components that were assigned to C-O, C=O and O-H bonds at 530.7 Ev, 531.5 eV and 532.3 eV, respectively, in agreement with the literature [47,48].
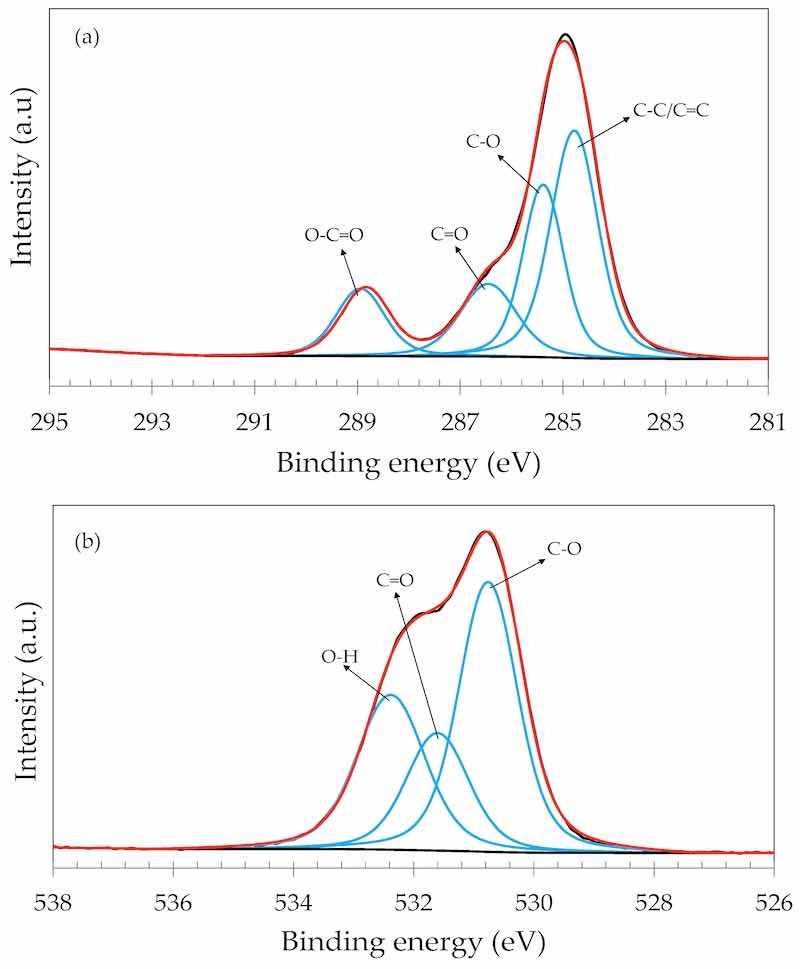
Figure 7. XPS narrow scan spectrum of the GO particles: (a) C 1s; (b) O 1s.
The anodized films were also characterized by XPS. The Mg 1s, Si 2p, B 1s and O 1s narrow scan spectra of the 0-GO sample are shown in Figure 8. The Mg 1s spectrum was deconvoluted with three components that were assigned to Mg(OH)2, MgO and Mg2SiO4, as reported by other authors [49,50]. The Si 2p spectrum (Figure 8b) displayed one single component assigned to silicate bonds due to the Mg2SiO4 compound in the anodized layer. The B 1s spectrum (Figure 8c) exhibited one single component assigned to B-O bonds, confirming that borate species are part of the anodized layer, as also observed by Okamoto et al. [49] and Ardelean et al. [51] for magnesium alloys anodized in borate-containing electrolytes. Oxygen species were identified from the O 1s narrow scan spectrum displayed in Figure 8d. The most intense peaks were assigned to O2− (oxide) and OH− (hydroxide) bonds. Adsorbed water (H2Oads) was also observed at higher binding energies, in good agreement with the literature [52,53].
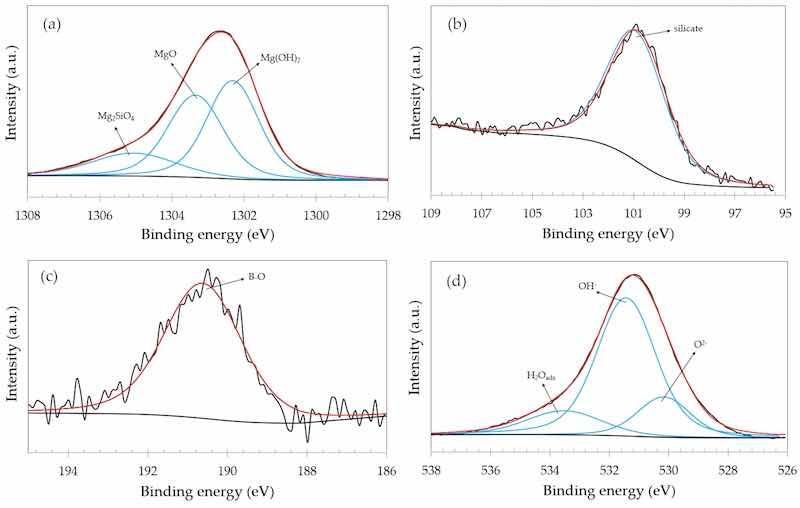
Figure 8. XPS narrow scan spectra of the 0-GO sample: (a) Mg 1s; (b) Si 2p; (c) B 1s; (d) O 1s.
The Mg 1s, Si 2p and B 1s narrow scan spectra were not affected by GO addition. The same components were identified for 0.5-GO, 1.0-GO and 3.0-GO. The results are shown as Supplementary Materials (Figures S6–S8 for the Mg 1s, Si 2p and B 1s spectra, respectively).
The C 1s and O 1s narrow scan spectra of the GO-containing anodized samples, in turn, exhibited additional features when compared to the GO particles (Figure 7). Representative spectra are shown in Figure 9 for the 3.0-GO sample. Similar C 1s and O 1s spectra were obtained for the 0.5-GO and 1.0-GO samples (Supplementary Materials, Figures S9 and S10). As seen in the C 1s spectrum (Figure 9a) a strong π-π* satellite was observed at the highest binding energy. This interaction has also been reported by other authors, being associated with the increase in the aromatic character of the GO structure that can originate from an oxidation process [48,54], such as the anodizing treatment of the ZK60A alloy. The O 1s spectrum (Figure 9b) was deconvoluted with four components, showing a mixture of bonds typical of the anodized layer (oxide and hydroxide bonds) and those of the GO structure (C-O, C=O, C-O-C). Both the C 1s and O 1s narrow scan spectra of the GO-containing samples show that GO was effectively incorporated into the anodic film during the anodization of the ZK60A alloy.
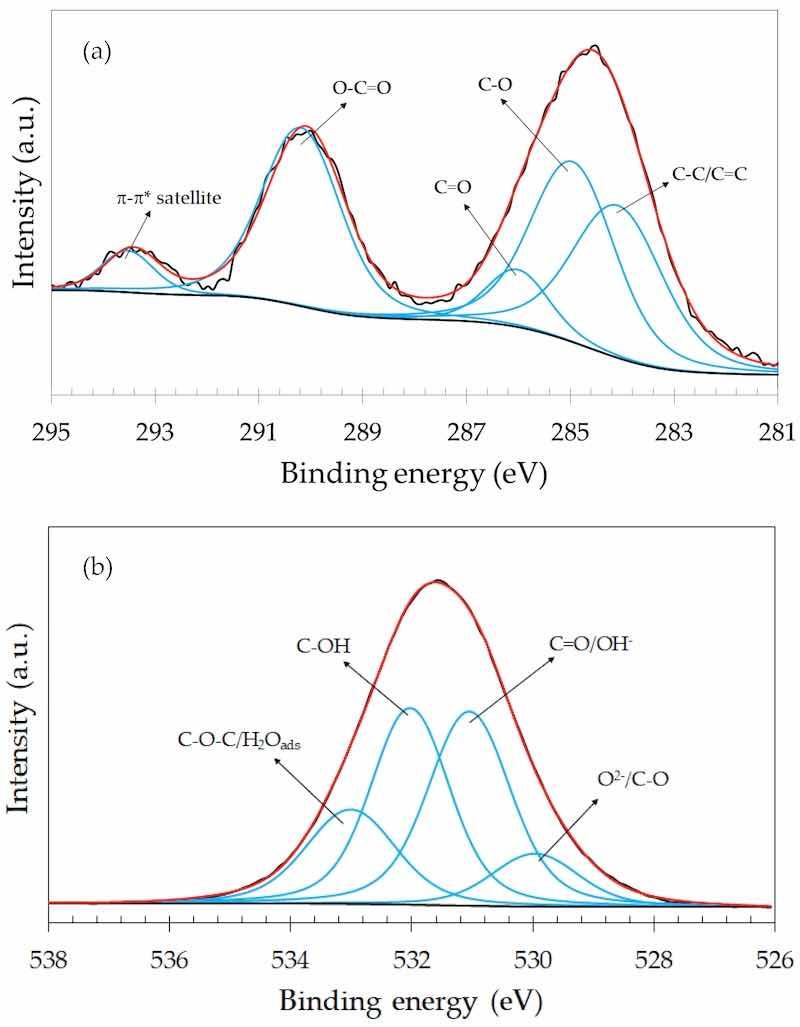
Figure 9. XPS narrow scan spectra of the 3.0-GO sample: (a) C 1s; (b) O 1s.
3.4. Corrosion Behavior
3.4.1. Electrochemical Impedance Spectroscopy (EIS)
Nyquist plots of the uncoated and anodized ZK60A alloy obtained in 3.5 wt.% NaCl solution at room temperature are shown in Figure 10a. The diameter of the semicircle is associated with the charge transfer resistance of the electrode surface [55,56]. The plot of the uncoated ZK60A alloy can be barely seen in Figure 10a, as it exhibits a capacitive loop whose diameter is much smaller than those of the anodized samples, thus indicating that the anodizing treatment greatly enhanced the corrosion resistance of the alloy. Figure 10b shows the Nyquist plots with expanded scales in order to allow one to visualize the result obtained for the uncoated ZK60A alloy.
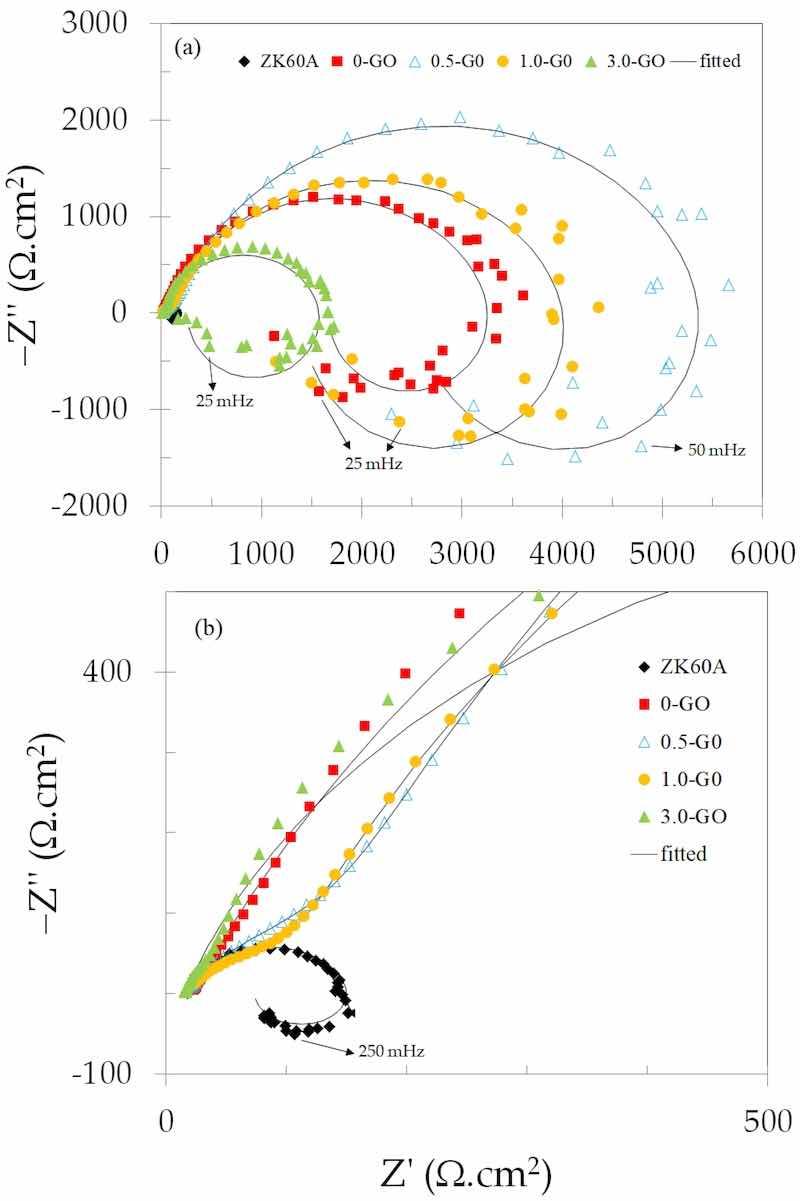
Figure 10. (a) Nyquist plots of the uncoated and anodized ZK60A alloy samples obtained in 3.5 wt.% NaCl solution at room temperature; (b) The same plots shown in (a) with expanded scales.
In addition to the capacitive loop that appears in the high-to-middle frequency range for all samples, another time constant is observed at low frequencies. It is characterized by an inductive loop. This behavior is typically found in magnesium alloys, being associated with the adsorption of ionized intermediate corrosion products such as Mg(OH)+ads [57,58].
The diameters of the capacitive loops were larger for the 0.5-GO and 1.0-GO samples when compared to the 0-GO (without GO addition). By increasing the GO concentration in the anodizing bath, the diameter of the capacitive loop decreased, as seen in Figure 10a for the 3.0-GO sample, which is even smaller than that of the sample without GO addition (0-GO). Electrical equivalent circuits (EECs) were used to fit the experimental EIS data, as shown in Figure 11. The EEC shown in Figure 11a was used to simulate the EIS response of the uncoated ZK60A substrate, whereas the one shown in Figure 11b simulated the responses of the anodized samples (with and without GO addition).
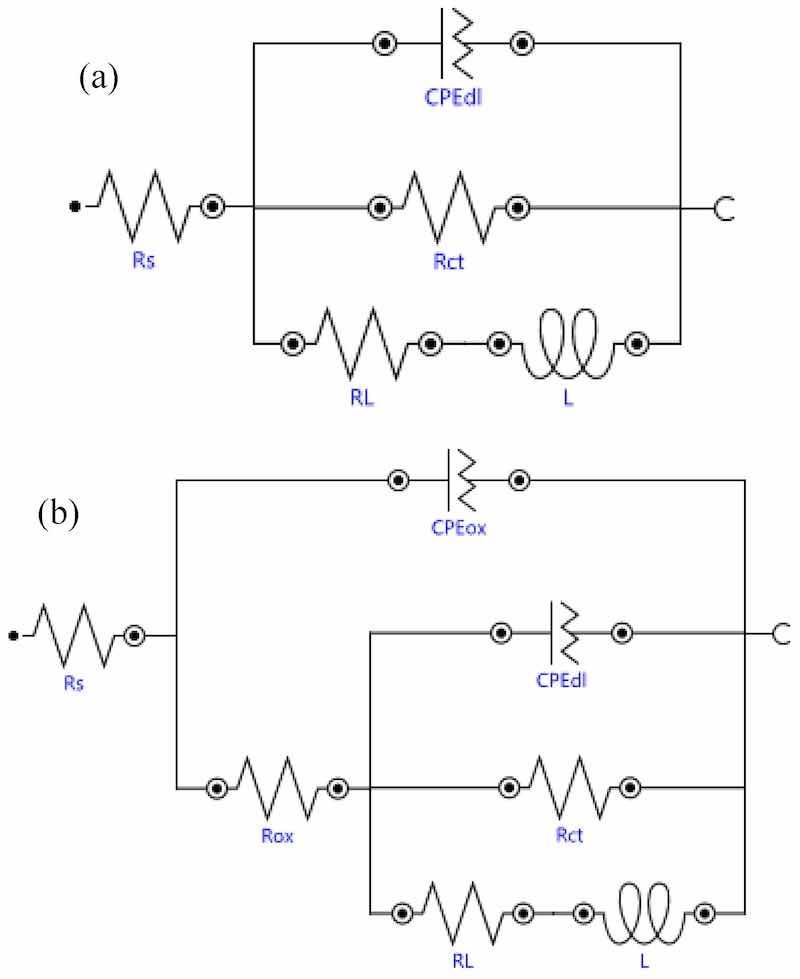
Figure 11. EECs used to fit the experimental EIS data: (a) uncoated ZK60A substrate; (b) anodized samples (with and without GO addition).
Constant phase elements (CPEs) were used instead of ideal capacitors to account for the heterogeneities of the electrode surface. The impedance of a CPE(ZCPE) is given by Equation (1), where Q is associated with the CPE capacitance, j is the complex operator, ω is the angular frequency and n is the CPE exponent which varies from 0 for a pure resistor to 1 for an ideal capacitor [59,60]. The physical meaning of the EEC parameters are given as follows: Rs is the solution resistance; CPEox is the capacitance of the oxide layer and Rox its resistance; CPEdl is the double layer capacitance and Rct is the charge transfer resistance. The local corrosion processes at the substrate are modeled by the inductive element (L) and its corresponding resistance (RL) [61]. The fitted values of the circuit parameters are displayed in Table 2.
𝑍𝐶𝑃𝐸=1/𝑄(𝑗𝜔)𝑛 (1)
Table 2. EIS fitting results using the EECs shown in Figure 11 for the uncoated ZK60A substrate and the anodized samples.
| Sample | Rs (Ω.cm2) | CPEox (10−6 Ω−1.cm−2.sn) | Rox (Ω.cm2) | nox | CPEdl (10−6 Ω−1.cm−2.sn) | Rct (Ω.cm2) | ndl | RL (Ω.cm2) | L (H.cm2) |
| Uncoated ZK60A | 18 | ---- | ---- | ---- | 138.0 | 97 | 0.91 | 134 | 287 |
| 0-GO | 22 | 13.8 | 3993 | 0.78 | 5.6 | 860 | 0.82 | 608 | 474 |
| 0.5-GO | 16 | 5.2 | 4595 | 0.72 | 7.5 | 920 | 0.86 | 784 | 704 |
| 1.0-GO | 15 | 6.8 | 5215 | 0.70 | 6.8 | 1032 | 0.85 | 459 | 74 |
| 3.0-GO | 15 | 17.4 | 853 | 0.70 | 8.5 | 750 | 0.83 | 335 | 540 |
The uncoated ZK60A substrate exhibited one time constant (CPEdl-Rct) in connection with the inductive component (RL-L), modeling the charge transfer reactions and adsorption of corrosive species on the surface of the electrode. After anodizing, a second time constant appeared due to the presence of the oxide layer (CPEox-Rox) in addition to the charge transfer reactions and inductive components.
The higher impedance values of the 0.5-GO and 1.0-GO samples when compared to the 0.G0 and 3.0-GO samples are also observed in the Bode magnitude plots(log |Z| vs. log f) shown in Figure 12a. The value of the impedance magnitude at low frequencies can be used to express the corrosion resistance of the electrode surface [62,63]. This trend confirms the indication of the Nyquist plots, revealing the apparent higher corrosion resistance of the 0.5-GO and 1.0-GO samples.
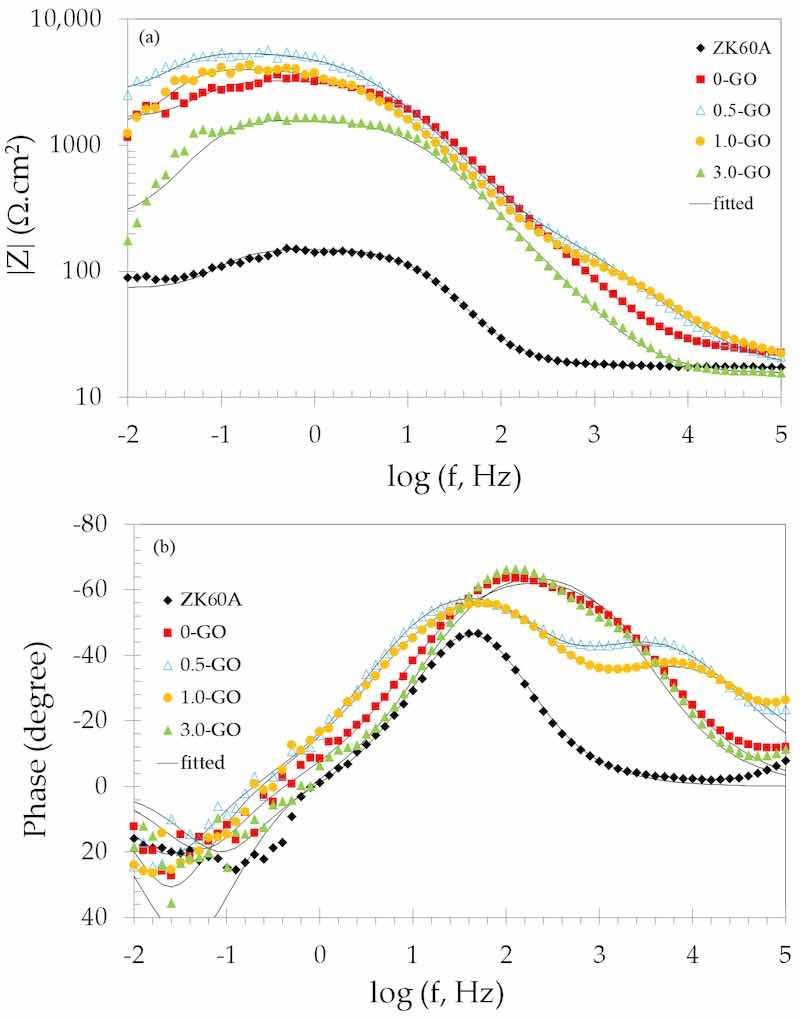
Figure 12. Bode plots of the uncoated and anodized ZK60A alloy samples obtained in 3.5 wt.% NaCl solution at room temperature: (a) Impedance magnitude; (b) Phase angle.
The Bode phase angle plots are displayed in Figure 12b. All anodized samples present more capacitive phase angles than the uncoated ZK60A alloy over the whole frequency range, indicating the increase in corrosion resistance after the anodizing treatment. The samples lose their capacitive response at the lowest frequencies, as the phase angles drop off at frequencies below 10 Hz, indicating that corrosion processes are taking place (inductive response—positive phase angles). This feature corresponds to the inductive behavior also observed in the low-frequency domain of the Nyquist plots (Figure 10). One can also notice that the drop-off of the phase angles occurs at lower frequencies for the 0.5-GO and 1.0-GO when compared to the 0-GO and 3.0-GO samples. Hence, the onset of corrosion processes is shifted to lower frequencies for the 0.5-GO and 1.0-GO samples, suggesting their anodic films display improved corrosion protection ability. Moreover, these samples exhibit two well-separated time constants in the frequency range of 105 to 101 Hz. The time constant at the highest frequency may be associated with the EIS response of the anodic film, whereas that at the lowest one is due to the charge transfer resistance arising from the corrosion processes at the base of the defects of the anodized layer [64,65]. In this regard, it is also noticeable that the high-frequency time constant of the 0.5-GO sample exhibits a more capacitive phase angle than that of the 1.0-GO. This may be due to two distinct effects, either related to the resistance or the capacitance of the anodic film. The capacitance (C) of a coating layer depends on the area exposed to the electrolyte (A) and also on its thickness (d), as seen in Equation (2), where ε0 is the vacuum permittivity and ε is the coating dielectric constant [66,67].
𝐶=𝜖𝜖0[𝐴/𝑑] (2)
Thus, based on Equation (2), the more capacitive phase angle of the 0.5-GO sample could be due to either an increase in the area exposed to the electrolyte or an increased resistance due to a high thickness of the anodic film, or a combination of both. In fact, the SEM cross-sectional micrographs (Supplementary Materials—Figure S4) confirmed that the thickness of the anodic film was increased for the 0.5-GO sample with respect to all other GO-containing anodized layers. Moreover, the porous nature of its top surface was also clearly seen in Figure 1b. As shown in Table 1, this was accompanied by a significant increase in surface roughness that was likely due to the faster growth rate of the anodic film for the 0.5-GO sample. This would lead to a reduced capacitance of the oxide layer (CPEox). Indeed, as shown in Table 2, this sample exhibited the lowest value of CPEox. As the GO concentration in the electrolyte increased, the surface roughness decreased, as well as the thickness of the anodic film, as shown in Section 2. On one hand, this led to an increase in the oxide film capacitance with respect to 0.5-GO, as can be seen in Table 2. On the other hand, the lower growth rate of the oxide film could also lead to the formation of a denser layer, thus increasing the corrosion protection ability, as observed for 1.0-GO. However, when GO concentration is excessive, in spite of the lower growth rate of the oxide film, agglomeration of GO particles may be detrimental to its corrosion resistance. This would explain the decreased value of the oxide film resistance (Rox) for 3.0-GO, as observed in Table 2. In order to give further understanding of the corrosion behavior of the anodic films formed on the ZK60A alloy, and the effect of GO addition to the anodizing bath, potentiodynamic polarization tests were also conducted, as described in the next section.
3.4.2. Potentiodynamic Polarization Curves
Figure 13 shows the potentiodynamic polarization curves of the uncoated and anodized ZK60A alloy in 3.5 wt.% NaCl at room temperature. The electrochemical parameters obtained from these curves are presented in Table 3. The corrosion current density (icorr) values were obtained by the Tafel extrapolation method, using the cathodic branches.
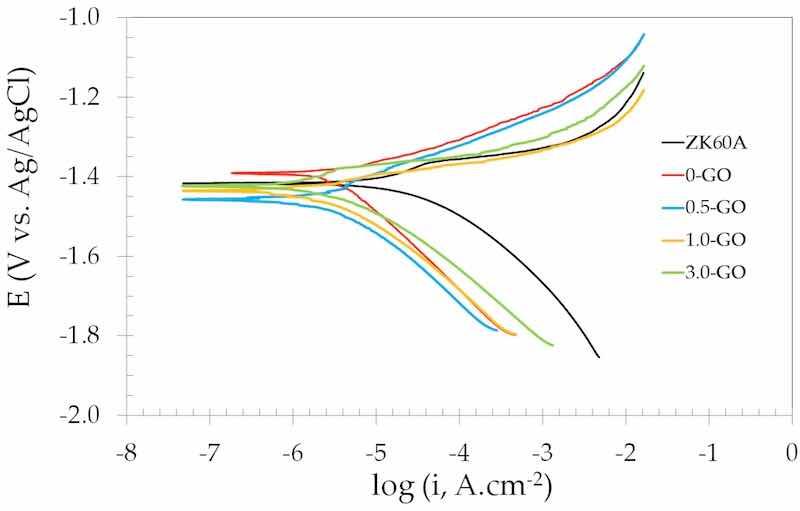
Figure 13. Potentiodynamic polarization curves of the uncoated and anodized ZK60A alloy samples obtained in 3.5 wt.% NaCl solution at room temperature.
Table 3. Electrochemical parameters obtained from the potentiodynamic polarization curves shown in Figure 13.
| Sample | Ecorr (mV vs. Ag/AgCl) | icorr (µA.cm−2) |
| Uncoated ZK60A | −1417 ± 20 | 24.5 ± 7.10 |
| 0-GO | −1390 ± 22 | 3.16 ± 0.58 |
| 0.5-GO | −1457 ± 7 | 2.40 ± 0.32 |
| 1.0-GO | −1435 ± 28 | 1.66 ± 0.23 |
| 3.0-GO | −1424 ± 10 | 2.75 ± 0.43 |
The corrosion potential (Ecorr) was little affected by the anodization process, independently of the GO concentration in the anodizing electrolyte. Conversely, the corrosion current density (icorr) was reduced by one order of magnitude after anodizing when compared to the uncoated ZK60A alloy. Interestingly, GO addition further decreased the values of icorr. As shown in Table 2, the slowing down of the corrosion rate was dependent on the GO concentration in the anodizing electrolyte. The lowest icorr was obtained for the 1.0-GO, which was reduced compared to 0.5-GO, suggesting that, by increasing the GO concentration from 0.5 g.L−1 to 1.0 g.L−1 in the anodizing electrolyte, the corrosion resistance was enhanced. Notwithstanding this beneficial effect, when the GO concentration was further increased to 3.0 g.L−1 (3.0-GO) the value of icorr was no longer reduced. This result is in agreement with the EIS results, showing that the GO concentration exhibits an optimum value in order to enhance the corrosion resistance of the anodized layer formed on the ZK60A alloy.
The explanation for such behavior can be derived from the following aspects. If one considers the roughness values (Ra) displayed in Table 1, there was a trend of increasing the roughness after anodization with respect to the uncoated ZK60A alloy. This trend was observed up to a GO concentration of 0.5 g.L−1 (0.5-GO). For higher GO concentrations, the surface roughness decreased. Although the corrosion resistance displayed a similar trend, being favored after anodization, it does not follow the same trend as the surface roughness. This can be promptly seen if one notices that the sample with the lowest roughness (3.0-GO) is not that with the lowest value of icorr (1.0-GO).
The XPS results (Section 3.3) revealed that the composition of the anodized layer was not significantly altered by GO addition with respect to the Mg 1s, Si 2p and B 1s spectra. As Mg, Si and B are incorporated into the anodizing electrolyte into the anodic film, it is reasonable to hypothesize that GO did not chemically interact with the main components of the anodized layer. Nevertheless, XPS unequivocally showed that GO was incorporated into the anodic film, as denoted by the C 1s and O 1s spectra of the anodized samples (Figure 9 and Figures S9 and S10). The corrosion behavior could not, therefore, be explained by differences between the surface chemical states of each sample.
As the compositional aspects and the surface topography were not the main factors influencing the electrochemical response of the anodized samples, one further aspect must be carefully examined. The morphology of the anodic films, as inferred from the SEM results presented in Section 3.1, was dependent on the GO concentration in the anodizing electrolyte. For example, when the GO was 0.5 g.L−1 (0.5-GO) the thickness of the anodic film was increased, as well as defects, such as microcracks and pores (Figure 1b and Figure S4) when compared to 0-GO (Figure 1a and Figure 4). The thick anodic film may be responsible for the increase in the impedance values, as shown in the Nyquist and Bode magnitude plots (Figure 10a and Figure 12a). However, even though the thick anodized layer would imply an impedance increase, it does not form a sufficiently compact film to slow down the corrosion kinetics, as the defects in the anodic film would constitute a preferential pathway to corrosive species. As reported in the literature, the main effect of GO particles is related to the enhancement of the barrier properties of anodic films by increasing the diffusion pathway of corrosive species [35]. There is, therefore, a critical GO concentration that would give the necessary compactness and, hence, improve the corrosion resistance of the anodic film. In this respect, the 1.0-G0 sample displayed a surface film that was thinner than that formed on 0.5-GO (Figure S5) but exhibited fewer defects. Hence, on one hand, its impedance values are lower due to the thinner oxide film, as observed in the Nyquist and Bode impedance plots (Figure 10a and Figure 11a). On the other hand, it also displayed the lowest icorr (Table 3), indicating the thin and compact oxide film provided a better barrier property than the thick and defective film formed on the 0.5-GO sample. By further increasing the GO concentration (3.0-GO) the impedance values decreased (Figure 10a and Figure 12a) and icorr increased (Table 3). As shown in Figure 5, the anodic film of this sample is as thin as that of 1.0-GO. Figure 1d points to the formation of a surface film that is more compact than that of the 0.5-GO as well. In spite of these apparently favorable morphological features, the loss of corrosion resistance when compared to 1.0-GO is evident. It is likely that the increase in GO concentration would cause an undesirable agglomeration effect, that hampers the distribution of GO within the anodized layer, thus diminishing the pore-blocking effect of GO, as reported by other authors for composite coatings containing GO [68,69,70,71].
4. Conclusions
Graphene oxide was effectively incorporated into the anodized layer when used as an additive to the anodizing electrolyte of the ZK60A magnesium alloy. XPS results showed that typical graphene oxide functional groups were observed in the anodized layers for all concentrations tested in the present work.
In spite of the GO incorporation into the anodic films, the corrosion resistance of GO-containing layers was dependent on the GO concentration in the anodizing bath. The optimum concentration was 1.0 g.L−1, as denoted by the increase in impedance magnitude and decrease in corrosion current density obtained at this condition. Further increase in GO concentration to 3.0 g.L−1 reduced the corrosion resistance of the anodized layer.
The morphology of the anodic film was affected by GO concentration and influenced its corrosion properties. A thick and defective film was obtained for the anodizing bath containing a GO concentration of 0.5 g.L−1, whereas a thin and more compact layer was formed when the GO concentration was raised to 1.0 g.L−1.
Written by Paula Lima Braga1, Denise Criado Pereira de Souza2, Mara Cristina Lopes de Oliveira1 and Renato Altobelli Antunes1
- Centro de Engenharia, Modelagem e Ciências Sociais Aplicadas (CECS), Universidade Federal do ABC (UFABC), Santo André 09210-580, SP, Brazil
- Centro de Ciências Naturais e Humanas (CCNH), Universidade Federal do ABC (UFABC), Santo André 09210-580, SP, Brazil
Author Contributions: Conceptualization, P.L.B. and R.A.A.; methodology, P.L.B., D.C.P.d.S. and R.A.A.; validation, P.L.B. and R.A.A.; investigation, P.L.B., D.C.P.d.S. and M.C.L.d.O.; data curation, M.C.L.d.O., P.L.B. and R.A.A.; writing—original draft preparation, M.C.L.d.O. and R.A.A.; writing—review and editing, M.C.L.d.O. and R.A.A.; supervision, R.A.A.; project administration, R.A.A. All authors have read and agreed to the published version of the manuscript.
Funding: This research was funded by Brazilian Agency CAPES (Finance Code 001).
Data Availability Statement: The data presented in this study are available on request from the corresponding author.
Acknowledgments: The authors are grateful to the Multiuser Experimental Facilities (CEM) of the Federal University of the ABC for the infrastructure necessary to develop this work.
Conflicts of Interest: The authors declare no conflicts of interest.
References
- Liu, B.; Yang, J.; Zhang, X.; Yang, Q.; Zhang, J.; Li, X. Development and application of magnesium alloy parts for automotive OEMs: A review. J. Magnes. Alloys 2023, 11, 15–47.
- Bai, J.; Yang, Y.; Wen, C.; Chen, J.; Zhou, G.; Jiang, B.; Peng, X.; Pan, F. Applications of magnesium alloys for aerospace: A review. J. Magnes. Alloys 2023, 11, 3609–3619.
- Tan, J.; Ramakrishna, S. Applications of magnesium and its alloys: A review. Appl. Sci. 2021, 11, 6861.
- Hort, N.; Vogt, C.; Cohen, S.; Kainer, K.U.; Willumeit, R.; Feyerabend, F. Degradable biomaterials based on magnesium corrosion. Curr. Opin. Solid State Mater. Sci. 2008, 12, 63–72.
- Malik, A.; Wang, Y.; Cheng, H.; Nazeer, F.; Khan, M.A. Microstructure evolution of Mg-Zn-Zr magnesium alloy against soft steel core projectile. J. Mater. Sci. Technol. 2021, 79, 46–61.
- Wu, T.; Zhang, K. Corrosion and protection of magnesium alloys: Recent advances and future perspectives. Coatings 2023, 13, 1533.
- Talha, M.; Ma, Y.; Xu, M.; Wang, Q.; Lin, Y.; Kong, X. Recent advancements in corrosion protection of magnesium alloys by silane-based sol-gel coating. Ind. Eng. Chem. Res. 2020, 59, 19840–19857.
- Li, Z.; Peng, Z.; Qiu, Y.; Qi, K.; Chen, Z.; Guo, X. Study on heat treatment to improve the microstructure and corrosion behavior of ZK60 magnesium alloy. J. Mater. Res. Technol. 2020, 9, 11201–11219.
- Baek, S.-M.; Kim, B.; Park, S.S. Influence of intermetallic particles on the corrosion properties of extruded ZK60 Mg alloy containing Cu. Metals 2018, 8, 323.
- Chowdary, S.; Dumpala, R.; Kumar, A.S.; Kondaiah, V.V. Influence of heat treatment on the machinability and corrosion behavior of AZ91 Mg alloy. J. Magnes. Alloys 2018, 6, 52–58.
- Balaji, V.; Raja, V.K.B.; Palanikumar, K.; Aditya, N.; Rohit, V. Effect of heat treatment on magnesium alloys used in automotive industry: A review. Mater. Today. Proc. 2021, 46, 3769–3771.
- Huang, S.-J.; Wang, C.-F.; Subramani, M.; Fan, F.-Y. Effect of ECAP on microstructure, mechanical properties, corrosion behavior, and biocompatibility of Mg-Ca alloy composite. J. Comp. Sci. 2023, 7, 292.
- Zheng, Y.; Ma, Y.; Zang, L.; Chen, Y. Microstructure, corrosion behavior, and surface mechanical properties of Fe oxide coatings on biomedical ZK60 Mg alloy. Mater. Corros. 2019, 70, 2292–2302.
- Darband, G.B.; Aliofkhazraei, M.; Hamghalam, P.; Valizade, N. Plasma electrolytic oxidation of magnesium and its alloys: Mechanism, properties and applications. J. Magnes. Alloys 2017, 5, 74–132.
- Strbak, M.; Kajánek, D.; Knap, V.; Florková, Z.; Pastorková, J.; Hadzima, B.; Goraus, M. Effect of plasma electrolytic oxidation on the short-term corrosion behaviour of AZ91 magnesium alloy in aggressive chloride environment. Coatings 2022, 12, 566.
- Yuan, J.; Dai, B.; Cui, X.; Li, P. The effects of electrodeposition temperature on morphology and corrosion resistance of calcium phosphorus coatings on magnesium alloy: Comparative experimental and molecular dynamics simulation studies. RSC Adv. 2023, 13, 34145–34156.
- Zaffora, A.; Di Franco, F.; Virtú, D.; Pavia, F.C.; Ghersi, G.; Virtanen, S.; Santamaria, M. Tuning of the Mg alloy AZ31 anodizing process for biodegradable implants. ACS Appl. Mater. Interfaces 2021, 13, 12866–12876.
- Blawert, C.; Dietzel, W.; Ghali, E.; Song, G. Anodizing treatments for magnesium alloys and their effect on corrosion resistance in various Environments. Adv. Eng. Mater. 2006, 8, 511–533.
- Pan, S.; Tu, X.; Yu, J.; Zhang, Y.; Miao, C.; Xu, Y.; Fu, R.; Li, J. Optimization of AZ31B magnesium alloy anodizing process in NaOH-Na2SiO3-Na2B4O7 environmental-friendly electrolyte. Coatings 2022, 12, 578.
- Zhang, G.; Wu, L.; Tang, A.; Weng, B.; Atrens, A.; Ma, S.; Liu, L.; Pan, F. Sealing of anodized magnesium alloy AZ31 with MgAl layered double hydroxides layers. Rsc Adv. 2018, 8, 2248–2259.
- Santamaria, M.; Di Quarto, F.; Zanna, F.; Marcus, P. The influence of surface treatment on the anodizing of magnesium in alcaline solution. Electrochim. Acta 2011, 56, 10533–10542.
- Song, G.L.; Shi, Z. Corrosion mechanism and evaluation of anodized magnesium alloys. Corros. Sci. 2014, 85, 126–140.
- Fukuda, H.; Matsumoto, M. Effects of Na2SiO3 on anodization of Mg-Al-Zn alloy in 3 M KOH solution. Corros. Sci. 2004, 46, 2135–2142.
- Zhang, P.; Zuo, Y.; Nie, G. The enhanced properties of anodic films on AZ91D magnesium alloy by addition of oxide nanoparticles. J. Alloys Compd. 2020, 834, 155041.
- Seyfi, M.; Fattah-alhosseini, A.; Pajohi-Alamoti, M.; Nikoomanzari, E. Effect of ZnO nanoparticles addition to PEO coatings on AZ31B Mg alloy: Antibacterial effect and corrosion behavior of coatings in Ringer’s physiological solution. J. Asian Ceramic Soc. 2021, 9, 1114–1127.
- Gnedenkov, S.V.; Sinebryukhov, S.L.; Mashtalyar, D.V.; Imshinetskiy, I.M.; Samokhin, A.V.; Tsvetkov, Y.V. Fabrication of coatings on the surface of magnesium alloy by plasma electrolytic oxidation using ZrO2 and SiO2 nanoparticles. J. Nanomat. 2015, 2015, 154298.
- Zhang, D.; Gou, Y.; Liu, Y.; Guo, X. A composite anozing coating containing superfine Al2O3 particles on AZ31 magnesium alloy. Surf. Coat. Technol. 2013, 236, 52–57.
- Oliveira, M.C.L.; Antunes, R.A. Graphene-based coating for magnesium alloys: Exploring the correlation between coating architecture, deposition methods, corrosion resistance and materials selection. Corros. Rev. 2022, 40, 427–451.
- Askarnia, R.; Fardi, S.R.; Sobhani, M.; Staji, H. Ternary hydroxyapatite/chitosan/graphene oxide composite coating on AZ91D magnesium alloy by electrophoretic deposition. Ceram. Int. 2021, 47, 27071–27081.
- Cui, G.; Bi, Z.; Zhang, R.; Liu, J.; Yu, X.; Li, Z. A comprehensive review on graphene-based anti-corrosive coatings. Chem. Eng. J. 2019, 373, 104–121.
- Jena, G.; Philip, J. A review on recent advances in graphene oxide-based composite coatings for anticorrosion applications. Prog. Org. Coat. 2022, 173, 107208.
- Shang, W.; Wu, F.; Wang, Y.; Baboukani, A.R.; Wen, Y.; Jiang, J. Corrosion resistance of micro-arc oxidation/graphene oxide composite coatings on magnesium alloys. ACS Omega 2020, 5, 7262–7270.
- Wen, C.; Zhan, X.; Huang, X.; Xu, F.; Luo, L.; Xia, C. Characterization and corrosion properties of hydroxyapatite/graphene oxide bio-composite coating on magnesium alloy by one step micro-arc oxidation method. Surf. Coat. Technol. 2017, 317, 125–133.
- Ikhe, A.B.; Kale, A.B.; Jeong, J.; Reece, M.J.; Choi, S.-H.; Pyo, M. Perfluorinated polysiloxane hydridized with graphene oxide for corrosion inhibition of AZ31 magnesium alloy. Corros. Sci. 2016, 109, 238–245.
- Zhao, J.; Xie, X.; Zhang, C. Effect of graphene oxide additive on the corrosion resistance of the plasma electrolytic oxidation coating of the AZ31 magnesium alloy. Corros. Sci. 2017, 114, 146–155.
- Gao, H.; Zhang, M.; Yang, X.; Huang, P.; Xu, K. Effect of Na2SiO3 solution concentration of micro-arc oxidation process on lap-shear strength of adhesive-bonded magnesium. Appl. Surf. Sci. 2014, 314, 447–452.
- Ahn, B.H.; Song, J.I.; Koo, B.H. Effect of electrolyte on mechanical properties of AZ31B Mg alloy in electrolytic plasma processing. Trans. Nonferrous Met. Soc. China 2014, 24, s125–s128.
- Grigoriev, S.; Peretyagin, N.; Apelfeld, A.; Smirnov, A.; Morozov, A.; Torskaya, E.; Volosova, M.; Yanushevich, O.; Yarygin, N.; Krikheli, N.; et al. Investigation of tribological characteristics of PEO coatings formed on Ti6Al4V titanium alloy in electrolyte with graphene oxide additives. Materials 2023, 16, 3928.
- Zhou, X.; Zhang, S.; Song, Y.; Qin, H.; Xiong, C.; Wang, S.; Xie, D.; Fan, R.; Chen, D. A novel and green 3-amino-1,2,4-triazole modified graphene oxide nanomaterial for enhancing anti-corrosion performance of water-borne epoxy coatings on mild steel. Prog. Org. Coat. 2024, 187, 108106.
- Akbarzadeh, S.; Ramezanzaden, M.; Ramezanzadeh, B.; Bahlakeh, G. A green assisted route for the fabrication of a high-efficiency self-healing anti-corrosion coating through graphene oxide nanoplatform reduction by Tamarindus indiaca extract. J. Hazard. Mater. 2020, 390, 122147.
- Derelizade, K.; Venturi, F.; Wellman, R.G.; Khlobystov, A.; Hussain, T. Structural changes of thermal sprayed graphene nanoplatelets film into amorphous carbon under sliding wear. Appl. Surf. Sci. 2020, 528, 146315.
- Dresselhaus, M.S.; Jorio, A.; Hofmann, M.; Dresselhaus, G.; Saito, R. Perspectives on carbon nanotubes and graphene Raman spectroscopy. Nano Lett. 2010, 10, 751–758.
- Mulone, A.; Xia, Z.; Klement, U. Electrodeposition of FeW-graphene composites: Effect of graphene oxide concentration on microstructure, hardness and corrosion properties. FlatChem 2023, 40, 100525.
- Thoume, A.; Left, D.B.; Elmakssoudi, A.; Safi, Z.S.; Benzbiria, N.; Berisha, A.; Kellal, R.; Zertoubi, M. An in-depth on the high corrosion resistance of carbon steel in an acidic solution by a novel functionalized graphene oxide with oxide derivative via cutting-edge experimental characterization and computational modeling. Mater. Chem. Phys. 2023, 310, 128487.
- Zak, A.K.; Hashim, A.M. Synthesis, characterization and cytotoxicity studies of Au-decorated graphene oxide nanosheets. Ceram. Int. 2023, 49, 18577–18583.
- Wang, T.; Dong, Y.; Xu, Y.; Li, G.; Guo, Y.; Lian, J.; Zhang, Z.; Ren, L. A calcium phosphate coating improving corrosion resistance of the biodegradable magnesium alloy with graphene oxide modifying the deposition. Ceram. Int. 2023, 49, 11926–11935.
- Zhang, W.; Li, B.; Mei, T.; Li, M.; Hong, M.; Yuan, Z.; Chu, H. Effects of graphene oxide and current density on structure and corrosion properties of nanocrystalline nickel coating fabricated by electrodeposition. Colloids Surf. A 2022, 648, 129220.
- Haubner, K.; Murawski, J.; Olk, P.; Eng, L.M.; Ziegler, C.; Adolphi, B.; Jaehne, E. The route to functional graphene oxide. ChemPhysChem 2010, 11, 2131–2139.
- Qiu, Z.; Wang, R.; Zhang, Y.; Qu, Y.; Wu, X. Study of coating growth behavior during the plasma electrolytic oxidation of magnesium alloy ZK60. J. Mater. Eng. Perform. 2015, 24, 1483–1491.
- Okamoto, F.; Oliveira, M.C.L.; Silva, A.A.; Droppa, R., Jr.; Antunes, R.A. Effect of anodization on the stress corrosion cracking behavior of the AZ61 magnesium alloy in 0.1 M NaCl solution. Mater. Res. 2023, 26, e20220357.
- Ardelean, H.; Frateur, I.; Zanna, S.; Atrens, A.; Marcus, P. Corrosion protection of AZ91 magnesium alloy by anodizing in niobium and zirconium-containing electrolytes. Corros. Sci. 2009, 51, 3030–3038.
- Lakshimi, R.V.; Aruna, S.T.; Anandan, C.; Bera, P.; Sampath, S. EIS and XPS studies on the self-healing properties of Ce-modified silica-alumina hybrid coatings: Evidence for Ce(III) migration. Surf. Coat. Technol. 2017, 309, 363–370.
- Oliveira, L.A.; Silva, R.M.P.; Rodas, A.C.D.; Souto, R.M.; Antunes, R.A. Surface chemistry, film morphology, local electrochemical behavior and cytotoxic response of anodized AZ31B magnesium alloy. J. Mater. Res. Technol. 2020, 9, 14754–14770.
- Hortigüela, M.J.; Machado, D.; Bdikin, I.; Neto, V.; Otero-Irurueta, G. Chemical changes of graphene oxide thin films induced by thermal treatment under vacuum conditions. Coatings 2020, 10, 113.
- Choi, H.Y.; Kim, W.J. Development of the highly corrosion resistant AZ31 magnesium alloy by the addition of a trace amount of Ti. J. Alloys Compd. 2016, 664, 25–37.
- Osipenko, M.A.; Kasach, A.A.; Adamiec, J.; Zimowska, M.; Kurilo, I.I.; Kharytonau, D.S. Corrosion inhibition of magnesium alloy AZ31 in chloride-containing solutions by aqueous permanganate. J. Solid State Electrochem. 2023, 27, 1847–1860.
- Kharitonov, D.S.; Zimowska, M.; Ryl, J.; Zielinski, A.; Osipenko, M.A.; Adamiec, J.; Wrzesinska, A.; Claesson, P.M.; Kurilo, I.I. Aqueous molybdate provides effective corrosion inhibition on WE43 corrosion inhibition of WE43 magnesium alloy in sodium chloride solutions. Corros. Sci. 2021, 190, 109664.
- King, A.D.; Birbilis, N.; Scully, J.R. Accurate electrochemical measurement of magnesium corrosion rates: A combined impedance, mass-loss and hydrogen collection study. Electrochim. Acta 2014, 121, 394–406.
- Gu, J.-L.; Lu, S.-Y.; Shao, Y.; Yao, K.-F. Segregating the homogeneous passive film and understanding the passivation mechanism of Ti-based metallic glasses. Corros Sci. 2021, 178, 109078.
- Qiao, X.Y.; Zheng, Y.G.; Ke, W.; Okafor, P.C. Electrochemical behaviour of high nitrogen stainless steel in acid solution. Corros. Sci. 2009, 51, 979–986.
- Jiao, Z.-J.; Yu, C.; Wang, X.-M.; Zhou, Y.-F.; Guo, L.; Xia, Y.; Zhang, B.-C.; Zeng, R.-C. Corrosion resistance enhanced by an atomic layer deposited Al2O3/micro-arc oxidation coating on magnesium alloy AZ31. Ceram. Int. 2024, 50, 5541–5551.
- Zhang, S.; Bi, Y.; Li, J.; Wang, Z.; Yan, J.; Song, J.; Sheng, H.; Guo, H.; Li, Y. Biodegradation behavior of magnesium and ZK60 alloy in artificial urine and rat models. Bioact. Mater. 2017, 2, 53–62.
- Heidari, E.; Atapour, M.; Obeydavi, A. The effect of Cr-content on the corrosion behavior of Ti0.5Mo0.5CoNiMnCrx high-entropy alloy thin films deposited by direct current magnetron sputtering. J. Alloys Compd. 2024, 976, 173265.
- Han, H.; Wang, R.; Wu, Y.; Zhang, X.; Wang, D.; Yang, Z.; Su, Y.; Shen, D.; Nash, P. An investigation of plasma electrolytic oxidation coatings on crevice surface of AZ31 magnesium alloy. J. Alloys Compd. 2019, 811, 152010.
- Guo, X.; An, M.; Yang, P.; Li, H.; Su, C. Effects of benzotriazole on Anodized film formed on AZ31B magnesium alloy in environmental-friendly electrolyte. J. Alloys Compd. 2009, 482, 487–497.
- Akbarzadeh, S.; Naderi, R.; Mahdavian, M. Fabrication of a highly protective silane composite coating with limited water uptake utilizing functionalized carbon nanotubes. Compos. Part B 2019, 175, 107109.
- Calderon-Gutierrez, J.A.; Bedoya-Lora, F.E. Barrier property determination and lifetime prediction by electrochemical impedance spectroscopy of a high performance organic coating. Dyna 2014, 81, 97–106.
- Jyotheender, K.S.; Srivastava, C. Ni-graphene oxide Composite coatings: Optimum graphene oxide for enhanced corrosion resistance. Compos. Part B 2019, 175, 107145.
- Calovi, M.; Rossi, S.; Deflorian, F.; Dirè, S.; Ceccato, R. Effect of functionalized graphene oxide concentration on the corrosion resistance properties provided by cataphoretic acrylic coating. Mater. Chem. Phys. 2020, 239, 121984.
- Zhang, Y.; Chen, F.; Zhang, Y.; Du, C. Influence of graphene oxide additive on the tribological and electrochemical corrosion properties of a PEO coating prepared on AZ31 magnesium alloy. Tribol. Int. 2020, 146, 106135.
- Guo, Z.; Wang, N.; Chen, Y.; Xu, Y.; Zhao, Q.; Zhang, Y.; Bai, X.; Yu, Y.; Zhao, Y. Regulation the graphene oxide concentration for the low energy consumption ceramic coating. Prog. Org. Coat. 2024, 188, 108200.
Disclaimer/Publisher’s Note: The statements, opinions and data contained in all publications are solely those of the individual author(s) and contributor(s) and not of MDPI and/or the editor(s). MDPI and/or the editor(s) disclaim responsibility for any injury to people or property resulting from any ideas, methods, instructions or products referred to in the content.
© 2024 by the authors. Licensee MDPI, Basel, Switzerland. This article is an open access article distributed under the terms and conditions of the Creative Commons Attribution (CC BY) license (https://creativecommons.org/licenses/by/4.0/).