


This research examines the corrosion behavior of tin-zinc alloy electrodeposits on a steel substrate.
 Howard Pickering and Eric Maurer.These coatings were prepared using the commercial Dipsol SZ-242 plating solution. Previous research has shown that tin and zinc plate out as separate crystalline phases of nearly pure Sn and Zn in accord with the phase diagram.
When potentiodynamic scans were run in a slightly acidic (pH 3.6) solution from open circuit potential (OCP) to more positive values, zinc was seen to preferentially dissolve from the Sn-Zn coating. Polarization tests were performed on the Sn-Zn coating to follow the changes in structure that occur as a function of the extent of zinc dissolution.
Scanning electron microscopy (SEM), in conjunction with qualitative image analysis software, was used to obtain data that could be used to evaluate the role of the IR voltage in the corrosion mechanism associated with the selective dissolution of the zinc from the coating.
Editor’s Note: originally published in 2004.
Introduction
Protection of the environment and safety of employees are obvious topics of concern for all industry. In an effort to eliminate these concerns, some materials and manufacturing processes have been under great scrutiny. One such material is cadmium, which has been widely used as a protective coating in the plating industry due to its corrosion resistance, lubricity, and low electrical resistivity1,2 . However, cadmium and its compounds have been found to be highly toxic and carcinogenic. This fact causes ecological, toxic, and even economic concerns for not only the plating industry, but for all parts of the manufacturing sector that rely on cadmium.
This push to replace cadmium platings with safer materials has put research for comparative, if not superior, substitutes in great demand. One such substitute for cadmium deposits is tin-zinc alloy electrodeposits. Tin-Zinc alloy electrodeposits provide an increased corrosion resistance when compared to cadmium deposits, no visible corrosion product, bright matte finish, and have excellent solderability3. Although some research has been done to identify the corrosion-related properties of tin-zinc electrodeposits, the mechanisms associated with the selective dissolution of zinc and its nature as a sacrificial coating have not been fully explored or understood. The objective of this research is to better understand the corrosion mechanisms associated with tin-zinc alloy electrodeposits and to study how plating additives affect the plating process and resultant properties of the electrodeposit.
In order to optimize the properties of the tin-zinc electrodeposit, one must have a full understanding of its morphology. It has been stated that tin-zinc alloy electrodeposits consist of fine zinc grains in a matrix of tin2. However, in order to determine the impact of the IR voltage drop5 associated with preferential zinc dissolution and the formation of pores in the deposit, one needs a better understanding of the morphology and size of tin and zinc deposits and how this morphology changes with increasing corrosion time.
Experimental
Materials
Substrates used in this study consisted mainly of 0.07 cm thick coupons of carbon steel that had been cold rolled and subsequently annealed at an unknown time and temperature. A copper wire was soldered to the back of the steel coupon. The front face of the steel coupon was then polished with 800 grit SiC polishing paper to produce a uniform starting surface for the plating process. Immediately after polishing, the coupons were degreased with acetone and rinsed with double distilled water. An insulating lacquer (Microstop Stop-off Lacquer) was applied to all exposed areas other than a 1 cm x 1cm (0.39in x 0.39in) area, which was the area of interest for plating and subsequent corrosion tests. This step was important in order to control the current density during electroplating, which in turn, controls the final Sn/Zn ratio in the electrodeposit.
Electroplating
A commercially available plating solution from Dipsol of America Inc. was used in all plating processes. This was done to insure the consistence and quality of the electrodeposit. Unfortunately, the exact composition of the plating bath is unknown due to it being proprietary information. A 70%/30% tin/zinc electrodeposit ratio was achieved by applying a current density of 5 mA/cm2 during the electroplating of steel samples. Electroplating was performed at room temperature (25ºC, 76ºF) under a non-static condition by the bubbling of purified nitrogen.
For purification, reagent-grade nitrogen was passed through a purification train to remove oxygen and moisture. The nitrogen addition was done to remove oxygen, agitate the solution, and be consistent with previous tests. Typically, the plating time was 50 minutes, which resulted in an electrodeposit thickness of approximately 10 µm.
Corrosion Tests
A three-electrode glass cell was used for all plating and corrosion tests in which the steel was used as the substrate. All potentiostat driven corrosion experiments were performed at room temperature in a corrosive solution of 0.1M Na2SO4 with the pH value adjusted to 3.6 by adding sulfuric acid. The 0.1 M Na2SO4 solution was prepared by the addition of 14.2 grams of Na2SO4 in 1 liter of double distilled water. Deaeration of the solution to remove oxygen was performed by bubbling nitrogen through the solution for 30 minutes prior to sample testing. Pre-purified nitrogen was also bubbled through the solution during tests for agitation of the solution. The pH 3.6 of the solution, which was in the range of acid rain, was selected so data could be compared to earlier research and secondly because solid film formation is unlikely during the corrosion process at this pH.
A carbon rod was used as the counter electrode, and was located in the cell facing the 1 cm2 test area of the sample. A saturated calomel electrode (SCE) was used as the reference electrode. The SCE was placed in a glass holder with the tip of the luggin capillary positioned 5 mm from the sample (a distance approximately equivalent to twice the outside diameter of the luggin capillary tip). An ionically conducting frit was placed at the tip of the luggin capillary to prevent chlorine ions, present in the reference electrode, from contaminating the solution near the specimen. The potentiostat (EG&G PAR model 273A) used in all potentiodynamic scans was controlled by a personal computer.
After the corrosive solution was poured into the cell, the specimen was left at open circuit potential (OCP) for 10 minutes to arrive at a stable and reproducible starting OCP. Progressive stages of preferential Zn dissolution were then performed by a potentiodynamic scan from the open circuit potential to more positive potentials. The scan was done to monitor the selective dissolution of zinc from the alloy electrodeposit. Each sample was scanned to a different potential, and then taken out of solution, rinsed with double distilled water and dried in air. Each scan to a particular potential was repeated three times using a fresh sample each time.
Characterization
The surfaces of the as-plated and corroded samples were observed by scanning electron microscopy (SEM) and by backscatter electron microscopy (BSE). Some of these samples were later analyzed by energy dispersive x-ray spectroscopy (EDX).
Optical microscopy and scanning electron microscopy (SEM) images were taken of the electrodeposit’s surface after each potentiodynamic scan. The surface of the electrodeposit was observed for determination of the morphology of the corrosive attack. Backscatter imaging was used in an attempt to view the regions of tin and zinc in the as-plated and partially corroded samples. The SEM images were then imported into a computer software program (Image-Pro Plus v 4.5). This software, often used in metallurgical analysis, can determine the relative amount of surface porosity of each corroded sample. For a more accurate measurement, several areas on each sample were taken into consideration during the calculations of surface porosity.
For a better understanding of the morphology of the tin-zinc alloy electrodeposits, cross sections were of the as plated and partially corroded samples were prepared. SEM and energy dispersive spectroscopy (EDS) mapping were performed on the cross sections for characterization. Elemental dot maps were then performed in an attempt to visualize the regions of tin and zinc throughout the cross section of the electrodeposit.
Results and Discussion
Tin-Zinc Alloy Electroplating
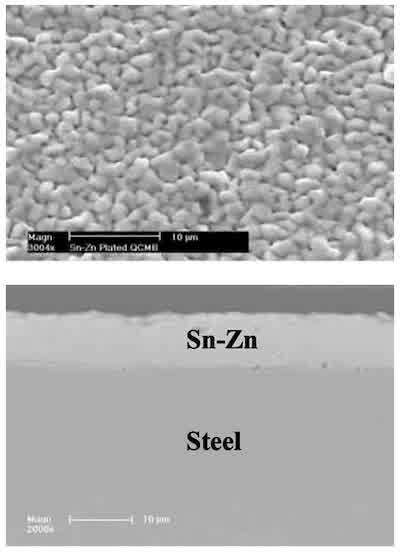 Figure1: SEM image of as-plated tin-zinc alloy electrodeposit surface. Figure 2: SEM image of the cross section of the as-plated tin-zinc alloy electrodeposit.Figure 1 is a SEM image showing that the as-plated electrodeposit has a surface microstructure on the scale of a few µm. At the boundaries of this microstructure, some very small depressions or pores appear to exist rather uniformly in a network pattern around the µm-scale deposits. When viewed under higher magnification, the depressions appeared to be shallow, indicating a surface roughness rather than a porosity that penetrates deeply into the Sn-Zn deposit thickness. Figure 2 is an image of the metallographically polished cross section of the as-plated tin-zinc alloy electrodeposit. It reveals a µm-scale surface roughness with minor imperfections existing below the surface which could be pores in an otherwise dense 10-µm thick of the Sn-Zn deposit.
These observations (Figures 1 & 2) and the knowledge that Sn is the majority phase (70%) help to reveal the microstructural evolution during electroplating as follows: During the early stages of electroplating, deposits of Sn form on the steel substrate resulting in recesses between the deposits where Zn then plates out, either on individual deposits or as a network phase between the Sn deposits. As the deposit thickens, this surface roughness where the thickness of the Sn deposits slightly exceed that of the Zn deposits may persist throughout the duration of plating thereby yielding the roughness shown in Figures 1 and 2. Therefore, even in the as-plated condition, very small recesses exist between the tin deposits with zinc residing at the base of the recesses.
Potentiodynamic Scans of the Electrodeposit
Figure 3 shows a potentiodynamic scan of the 70/30 tin-zinc alloy electrodeposit. An anodic current of approximately 10 µA is shown to exist until approximately -600 mV SCE when an increase in the current occurs. The low current plateau is likely due to solely zinc dissolution whereas the rising current at E > -600 mV SCE could be either the onset of Sn dissolution or, if the extent of Zn dissolution has exposed the steel substrate, the onset of iron dissolution. The drop off of current at potentials more positive than –500 mV SCE can be attributed to film formation on the Sn or steel surface. The increasing current at the end of the scan is due to Sn dissolution. This interpretation of the i-E curve in Figure 3 is largely based on the earlier i-E plots of the component metals shown in Figure 4. to the point where steel is exposed to the corrosive solution.
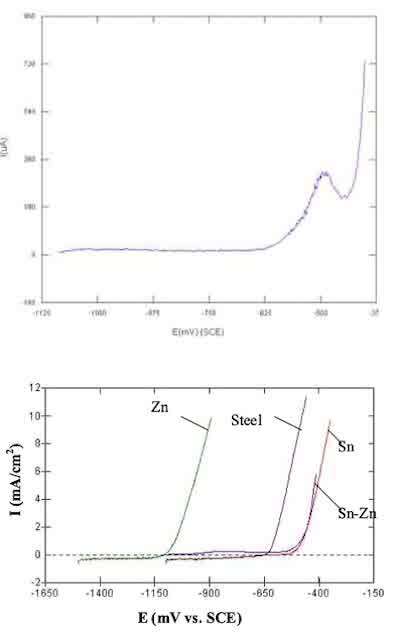 Figure 3: Potentiodynamic Scan of 70-30 Tin-Zinc Alloy Electrodeposit substrate in deaerated 0.1 M Na2SO4 solutions (pH 3.6). Potential scan direction is from negative to positive. Figure 4: Polarization curves of 70%Sn-30%Zn alloy, Zn, Sn, and steel substrate in deaerated 0.1 M Na2SO4 solution (pH 3.6). Potential scan direction is from negative to positive4.From the SEM micrographs in Figures 5 through 7, it appears that the microstructure that develops during the potential scan in the pH 3.6 solution is qualitatively the same as that of the electrodeposited surface shown in Figure 1. However, the (Sn) deposits appear more enhanced as if the zinc phase between them dissolved to form a void space and somewhat “sponge-like”structure. The tin-zinc alloy electrodeposit consists of fine grained mixtures of nearly pure tin and zinc phases. When corrosion of the electrodeposit takes place, the tin regions remain as the zinc regions dissolve into solution. Thus, the tin phase is what is mainly, if not entirely, seen in Figures 5 to 7 with void space between the Sn deposit being where the zinc phase existed prior to its dissolution during the scan. Therefore, it can be concluded that the as-plated zinc resided in the areas that after dissolution become pores or trenches, and that the Zn and Sn deposits exist as separate networks in the as-plated condition. The tin deposits are seen to be no larger than 5 µm in dimension and the thickness of the Zn network is noticeably smaller.
Figures 5 through 7 show a representation of the surface of the tin-zinc electrodeposit as a function of the final potential of the scan. Figure 7 shows the surface of the electrodeposit just before the potentials of either steel or tin dissolution are reached, which are shown to occur at -623 and –500 mV SCE, respectively, in Figure 4. Visually, there appears to be little to no variation in surface porosity. The amount of surface porosity was then calculated and is represented as a function of scanned potential in Figure 8. Standard deviation bars were added to the data points to reflect the variance in the data sets. Figure 8 shows only a slight upward trend in the surface porosity from approximately 5 to 12% as the time of zinc dissolution increased (represented by the more positive final scan potential). This increased trend of surface porosity persists even for final scan potentials that are above the potentials of tin and steel dissolution. The average of the surface porosity is 8 or 9 %. This consistency over a wide range of potential and dissolution time indicates that the pore depth increases more than the pore width.
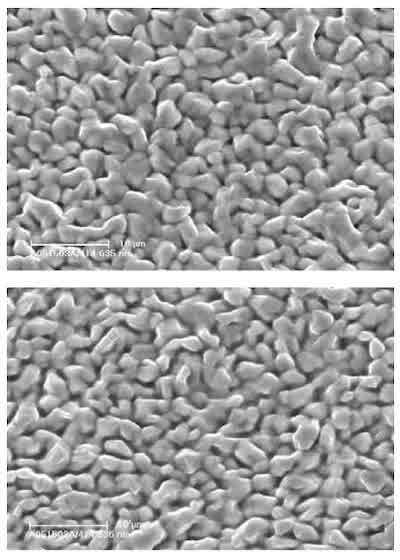 Figure 5: SEM image of electrodeposit surface after a potentiodynamic scan from OCP to –800 mV SCE. Figure 6: SEM image of electrodeposit surface after a potentiodynamic scan from OCP to –700 mV SCE.A cross section of the electrodeposit was then performed on the partially dissolved sample. Figure 9 represents the cross section of the electrodeposit after a potentiodynamic scan from OCP to -650 mV SCE. In this case, there is noticeable surface roughness highlighted by penetrations at a few µm spacing. Thus, these penetrations are on the same scale as what appear to be penetrations in the images of the surfaces of the scanned samples in Figures 5 to 7. In addition, there are what appear to be varying sizes of pores in the interior of the electrodeposit. In order to determine if pores reside in the tin-zinc layer close to the steel substrate surface, most of the thickness of a scanned sample was removed by polishing with 0.3 µm alumina suspension until small regions of steel could be seen in the microscope. Figure 10 shows the surface of the remaining electrodeposit after the polishing step. Because non-conductive materials charge when struck with an electron beam, it was concluded that the white particles in Figure 10 are residual alumina remaining despite post-polish cleaning. These particles would likely collect in low regions or recesses of the deposit during polishing. The clusters seen in Figure 10 are thus concluded to be residing in pores that existed deep in the scanned tin-zinc electrodeposition close to the steel/deposit interface. Therefore, it appears that the porosity formed when the zinc was dissolved out of the tin-zinc layer, and that it exists throughout the electrodeposit down to the steel substrate.
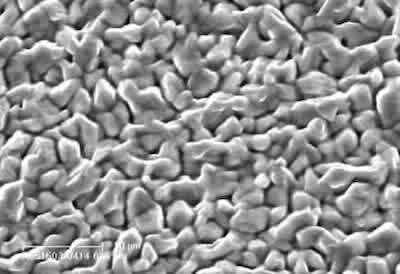 Figure 7: SEM image of electrodeposit surface after a potentiodynamic scan from OCP to –600 mV SCE.
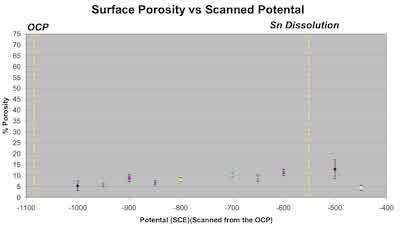 Figure 8: Surface porosity as a function of scanned potential.
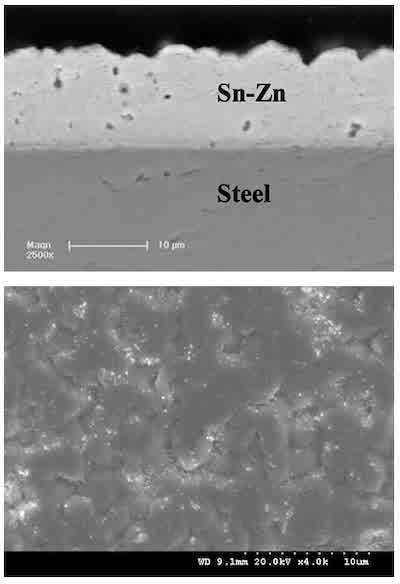 Figure 9: Cross section SEM image of the tin-zinc alloy electrodeposit after a potentiodynamic scan from OCP to -650 mV SCE Figure 10: SEM image of the surface of the remaining tin-zinc alloy electrodeposit after a potentiodynamic scan from OCP to -650 mV SCE and removal of much of the tin-zinc layer by mechanical polishing.EDS mapping of the as-plated cross section, shown in Figure 11, does not yield an accurate measure of the grain sizes for tin and zinc. This is likely due to the fact that resolution in backscattered imaging is limited due to beam interaction between the sub micron grains. However, Figure 11 does confirm that the distribution of zinc in the as- plated electrodeposit is fairly uniform throughout the entire plating thickness.
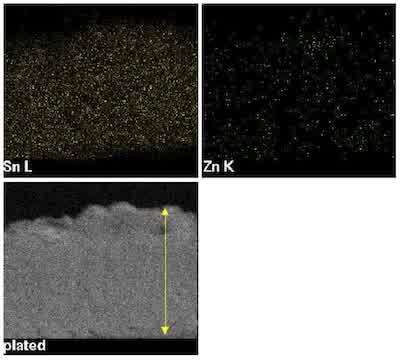 Figure11: EDS map of tin-zinc alloy electrodeposit with a thickness (indicated by the arrow) of 13 µm.
Conclusions
- Corrosion of the tin-zinc alloy electrodeposit first begins with selective dissolution of zinc. A porous network is created during the zinc dissolution that eventually extends all the way to the steel substrate, at which time the electrodeposit is mostly if not entirely composed of the tin phase and a network of void space.
- Some suggestion of passivation of the steel substrate at potentials significantly more positive than the OCP is apparent from the potentiodynamic scan.
- During electroplating, the reduction of zinc ions occurs at the base of crevices existing between tin deposits.
- The relative area of exposed tin remains nearly the same throughout the duration of zinc dissolution during the scan. This re-affirms that only zinc dissolves and neither steel nor tin dissolve at the OCP, so long as zinc is present in the tin-zinc electrodeposit.
Written by Eric Maurer, Howard W. Pickering, and Konrad Weil, with the Materials Research Institute, Department of Materials Science and Engineering at the Pennsylvania State University, University Park, PA.
References
- Cadmium Applications. 2004, http://www.cadmium.org.
- Wang, H.W.P., K.G. Weil, EQCM Studies of the Electrodeposition and Corrosion of Tin–Zinc Coatings. Electrochimica Acta, 2001. 46: p. 3835–3840.
- Budman, M.M., Tin-Zinc Plating. Metal Finishing, 1995(September).
- Wang, K., Electroplating and Corrosion Behavior of Tin-Zinc Alloy, PhD Thesis, Pennsylvania State University, 2002
- Pickering, H.W., Important Early Developments and Current Understanding of the IR Mechanism of Localized Corrosion. Journal of The Electrochemical Society, 2003. 150(5): p. K1 to K13.
About Dr. Pickering
Dr. Howard W. Pickering’s life’s work has been devoted to studying corrosion, understanding it and slowing its relentless action as much as technologically possible. He has been a leader in corrosion research, particularly as it applies to metal coatings, and electroplated coatings in particular. His work has led to an understanding of the mechanisms of corrosion processes for over 30 years with the collaboration of more than 60 graduate students and 45 colleagues. Specifically, he has elucidated corrosion phenomena in electrodeposited alloys, including zinc-based materials of commercial interest. His work in stress corrosion cracking and hydrogen absorption and cracking (i.e., hydrogen embrittlement) has contributed to the understanding of this phenomenon in metal finishing applications, including plated fasteners and aerospace components. Other work has contributed to other corrosion phenomena, including pitting and crevice corrosion, corrosion prevention, grain boundary phenomena and analytical techniques for corrosion study.
In his work, he has advanced the knowledge and science of the corrosion field and has mentored an abundance of Graduates who have entered the field and made contributions in their own right. These and the many accomplishments too numerous to mention here speak well of Dr. Pickering’s selection for the AESF Scientific Achievement Award. In 1958, Dr. Pickering received his B.S. in Metallurgical Engineering from the University of Cincinnati, which included CO-OP training in industry as well as academic pursuits. He then went on to Ohio State University, where he received his M.S. (1959) and Ph.D. degrees (1961), under the tutelage of Professor M.G. Fontana, one of the pioneers in corrosion research. Not content to stop there, he continued with Post-Doctoral research as a U. S. Steel Fellow at the Max-Planck-Institut fur Physikalische Chemie, in Gottingen, Germany, under Professor C. Wagner from 1964 to 1965.
His connection to U.S. Steel continued thru 1972, where he attained the position of Senior Scientist, Physical Chemistry Division, at the Edgar C. Bain Laboratory for Fundamental Research, of U.S. Steel Corporation, in Monroeville, PA. This industrial research background served as a superb qualification as Dr. Pickering returned to the academic world at Penn State in 1972, where he has remained to this day. He worked his way through the various levels, achieving the rank of Distinguished Professor of Metallurgy in 1990. During that time, he served as Chairman of the Metallurgy Program at Penn State (1975-1980) and was a Founding Director of the Corrosion Center at the Center for Advanced Materials.
Professor Pickering has been an active participant in the AESF Research program for many years, providing valuable research in the corrosion of coatings, particularly in the application areas of zinc and zinc-alloy plated steels, from electrogalvanized sheet to fasteners. In the process he has produced a number of capable scientists and teachers in their own right, many of whom have made their own contributions to our industry. Indeed, he has been responsible for the education of graduate and undergraduate students (approximately 12 annually) working on research projects in electrochemical corrosion, electrodeposition and surface science for their graduate degrees since the start of his academic career in 1972.
He has also been active in several sister professional societies, including the Electrochemical Society, ASM International and the National Association for Corrosion Engineers. He was Editor, (in charge of N. America) of the journal Corrosion Science (Pergamon Press), from 1975 to 1995 and has been a member of its Editorial Board, since 1975. He has been the recipient of many honors over the years, including the H. H. Uhlig Award of the Electrochemical Society in 1987. He is a Fellow of ASM International (2002), a Fellow of the Electrochemical Society (1995) and a Fellow of the National Association of Corrosion Engineers (1994).