


The study aimed to study the formation and characteristics of commercial zirconium conversion coatings referred to as MAVOMcoat MC1300 (Zr-Cr-based coating) and MC1700 (Zr-based coating) on chemically pre-treated aluminium alloy 3003.
 Maja Mujdrica Kim, Barbara Kapun and Ingrid Milošev.Conversion times varied from 80 s to 45 min. After deposition, the samples were subjected to three post-treatments: air drying for 15 min, air drying for 24 h, and immersion in 3.5 wt% NaCl solution for 24 h. Corrosion resistance was evaluated using electrochemical measurements, whereas scanning electron microscopy with energy dispersive spectroscopy and X-ray photoelectron spectroscopy were employed for surface analysis.
Based on the evaluation of corrosion parameters, the optimal conversion times for MC1700 and MC1300 were determined to be 10 min and 7 min, respectively. The conversion coatings MC1700 and MC1300 were characterised by distinct elemental compositions, with the former predominantly comprising Zr, O, Al and F, and the latter Zr, O, Al, Cr and F. Notably, the thickness of coatings was between 10 and 170 nm, depending on the type of coating and location (matrix or intermetallic particles). The 24-hour immersion of MC1700 ZrCC in 3.5 wt% NaCl led to progressive build-up of Zr oxide and release of fluoride from the coating.
As industries strive to reduce their environmental impact and address climate change concerns, the transition to environmentally friendly conversion coatings represents an important step towards a greener and more sustainable future. Zirconium-based conversion coatings (ZrCCs) have emerged as a promising and innovative surface treatment technique that provides advanced protection and functional improvements to various substrates, including metals like aluminium, steel, and magnesium.1,2 The first research and development in the field of ZrCC date back to the 1990s3,4 and are still ongoing.5–36 Recent works on the aqueous chemistry of Zr and its speciation in conversion baths have provided a stronger theoretical basis for understanding ZrCC formation.37 In addition, studies investigated the effect of surface pre-treatment on ZrCC efficiency, the optimisation of conversion bath parameters using statistical approaches, the integration of nano-additives, copper ions and polymer additives to enhance coating functionality, and the application of commercial Zr-Cr conversion coatings in multilayer protective systems for cast Al alloys.27–42 While many academic studies focus on simplified systems with defined compositions to elucidate the fundamental mechanisms of conversion coating formation,3,4,11–13,15,23,24,29–34,37 investigations involving commercial coatings are more application-oriented and often complicated by the proprietary nature of the bath formulations.6,8,18,20,27,28,31,35,43,44 Commercial systems frequently contain multiple additives (e.g., polymers, corrosion inhibitors, complexing agents), whose identities are not fully disclosed. Consequently, corrosion performance studies on commercial ZrCCs tend to emphasise overall effectiveness rather than mechanistic interpretation. The positive side of using the ZrCCs is that they do not contain toxic metals and are usually free of organic compounds.45,46 Further, the deposition process operates at room temperature, with minimal waste disposal, the possibility of rinsing water recirculation, and the control of bath parameters is relatively simple.47,48
During the last three decades, numerous studies have been published investigating zirconium conversion coatings applied on aluminium alloys (AAs).3–36,39–44 When considering ZrCCs on AAs, the difference in the stability of related oxide as a function of pH is worth considering. The Pourbaix diagram for Zr shows that ZrO2 is stable up to approximately pH 12–12.5, respectively,49 while Al2O3, a spontaneously formed passive layer of Al-based metals, is stable up to pH 9. Hence, mixed Zr/Al-oxide layers are corrosion-resistant up to higher pH values than Al2O3.50
Zr-based conversion coatings on aluminium alloys are formed by the interaction of the alloy substrate with a zirconium-based bath, which usually contains hexafluorozirconic acid (H2ZrF6) alone or in combination with hexafluorotitanic acid (H2TiF6),26,30,42,51 vanadium,29 or trivalent chromium compounds.27,28,33,40 The organic polymer may also be added to the conversion bath to improve corrosion protection and establish a base for subsequent painting.8,52,53 Fluoride in the conversion bath promotes the dissolution of the naturally formed aluminium oxide film.8,32,44,53
Our previous studies addressed the ZrCCs prepared from hexafluorozirconic acid.23,24,38,39 The three-layer structure was recognised by Šekularac and Milošev23 with a thickness of 200 nm in the proximity of intermetallic particles and 30 nm far from intermetallic particles at the coating matrix. ZrCC was prepared on aluminium-manganese alloy AA3005, and the corrosion resistance was improved during immersion in NaCl solution, ascribed to the densification of Al oxide and release of F from the coating. The role of incorporation of Mn in the region closer to the inner interface with metal was considered beneficial for corrosion resistance.23 A three-layer structure was also reported by Liu et al.54 for ZrCC on AA5083. The 1.5 μm coating significantly improved the corrosion resistance of AA5083 and the adhesion of the overlying epoxy resin.
The literature studies describing the corrosion performance of commercial Zr-based conversion coatings are somewhat limited. Schram et al.53 studied the composition of a commercial ZrCC containing mainly fluorinated zirconium salt and a water-soluble polymer. The results show a two-layered structure of ZrCC. The inner region, which is close to the metal interface, contains only Al and O, while the area closer to the outer surface includes a fluorinated zirconium oxide and a polymeric compound. The thickness of the conversion layer formed on AA1050 was nearly independent of the conversion time. Also, Li et al.18 reported that Zr/Ti coating (Bonderite M-NT 5200 (Henkel)) on AA2024 exhibited a two-phase structure consisting of a Zr/Ti oxide outer layer. A comparative study between different conversion coatings on AA2024 showed that Zr/Ti-based coating exhibited lower corrosion resistance compared to trivalent chromium process (TCP) coating Bonderite M-Cr T5900 (Henkel), and a chromate-free coating NCP (NAVAIR) bath that consists of Zr and Zn species.18 The hypothesis is that poorer corrosion resistance of the latter could result from a thin and porous coating structure.18 The TCP coating on AA2024 was approx. 50 nm thick, the fully hydrated coating thickness was estimated to be around 90–100 nm. The coating’s composition exhibited a dual-phase structure, comprising a hydrated zirconia overlayer and an interfacial layer rich in potassium and fluorine.55 The TCP coating provided both anodic and cathodic protection by physically blocking Al-rich sites (where the oxidation occurs) and Cu-rich intermetallics (where the reduction occurs).
Recently, several commercial TCP coatings were investigated in more detail. Glover et al. studied the effect of surface pre-treatment using TCP commercial coating (Zircobond PPG) on its ability to improve the filiform corrosion resistance of an organic coating deposited on AA7075.27 Sun et al. employed a tungsten pH microelectrode to study the formation of TCP (SurTec CromitaAL 650AL) on Al and AA2024.28 For the TCP SOCOSURF TCS deposited on AA2024, the effect of post-treatment containing hydrogen peroxide and lanthanum salt was studied by Stoica et al.31 and the nucleation and growth mechanism by Verdalet-Guardiola et al.35 The mechanism comprised a three-step process: (i) the dissolution of the native oxide and the formation of the precursor layer, (ii) the nucleation of the outer layer combined with an enrichment in fluorine in the inner layer, and (iii) the growth of both the outer and inner layers of the TCP coating.
In our previous studies,40,56 the Zr-Cr(III) conversion coating SurTec 650 was investigated as corrosion protection of cast AlSi7Mg0.3 and wrought AA3003. The difference in the composition of the conversion bath and conversion time resulted in variations in the sample surface morphology.56 The corrosion resistance of coated AA3003 samples was significantly improved with prolonged immersion (24 h at the open circuit potential in both electrolytes, 3.5 wt% sodium chloride solution and simulated acid rain). During extended immersion, the coatings function as effective anodic inhibitors. With a consistent conversion time of 18 min, raising the SurTec 650 bath concentration from 10 to 50 vol% led to a shift in the coating structure from a uniform nodular pattern (sized around 100 nm) to a non-uniform, cracked appearance. Similarly, Chen et al.57 reported that many cracks formed on the AA5052 surface following an extended period (600 s) of immersing in the trivalent chromium conversion solution. Experimental results showed that the conversion time between 30 and 300 s relates to the coating growth. The coatings formed at 300 s had a uniform structure where zirconium and chromium were concentrated in the inner and outer layers of the coating, respectively.57
With this work, we aimed to address the current lack of studies focused on ZrCCs deposited on AA3003. Most existing research has focused on ZrCCs for alloy series 1xxx,11,22,36 2024,18,19,28,31,33,35,36,41,44,55,58–63 5xxx,32,39,43,54,57 6xxx,8,20,26,29,30,34,42,58 and 7xxx,27 whereas their performance on 3xxx23,56 has received little attention and remains largely unexplored. We investigated the morphology, composition, and electrochemical properties of two Zr-based commercial conversion coatings differing in the presence of trivalent chromium, i.e. MAVOMcoat 1700 and MAVOMcoat 1300. Coatings were prepared at the same weight concentration at different conversion times. Before potentiodynamic measurements in 3.5 wt% NaCl and surface analysis, samples were subjected to (1) air-drying for 15 min, (2) air-drying for 24 h, and (3) 24 h immersion in 3.5 wt% NaCl. Electrochemical measurements, scanning electron microscopy (SEM) with energy-dispersive X-ray spectroscopy (EDS) and X-ray photoelectron spectroscopy (XPS) were employed to investigate the corrosion properties, surface composition and morphology of the deposited coatings. Focused ion beam (FIB) milling was used to prepare cross-sections for thickness measurements and detailed subsurface analysis.
Experimental
Materials, sample preparation and chemicals
The 50 micrometre-thick foil of aluminium alloy AA3003, produced by Impol 2000 d.d., Slovenia, was used as a substrate. The chemical composition of the alloy was Si 0.14 wt%, Fe 0.6 wt%, Cu 0.13 wt%, Mn 1.1 wt%, Zn 0.009 wt%, Cd 0.0003 wt% and Al 98.1 wt%, as specified by the manufacturer. The samples were cut in a rectangular shape with a dimension of 20 mm × 40 mm.
All samples were first ultrasonically cleaned (Elmasonic P 30 H) in absolute ethanol (Carlo Erba reactants) for 3 min to remove physically adsorbed organic contaminations from the surface and dried with pure compressed nitrogen (designated as bare-AA3003). The roughness (Ra) of the substrate was 0.175 μm ± 0.0051 μm, as was measured using five randomly selected 4-mm long lines using a stylus contact profilometer Bruker DektakXT model (Bruker, Billerica, MA, USA), equipped with a 2 μm tip, operating in a soft-touch mode with a force of 1 mN. The collected data were analysed using TalyMap Gold 6.2 software.
Mechanical grinding was not performed before conversion treatment. Preliminary tests showed that mechanical abrasion caused surface cracking due to the low thickness (50 μm) of the aluminium alloy sheet, making such treatment unsuitable.
Chemical pre-treatment was carried out using a mixture of 2 wt% SurTec 132 (pH = 8.3) and 0.5 wt% SurTec 089 (SurTec International GmbH, Germany) cleaning agents for 3 min at 40 °C. The surface was then desmutted for 30 s at room temperature with 50 wt% HNO3, pH= 1.5 (65%, Sigma Aldrich). After chemical pre-treatment and desmutting, the sample was rinsed with Milli-Q Direct water (Millipore, Billerica, MA) with resistivity ≥ 18.2 MΩ·cm at 25 °C and dried with nitrogen gas. Details about the optimisation of the chemical pre-treatment are described in our previous study.56 Chemically pre-treated samples are designated CP-AA3003.
The Zr-based chemical conversion solutions MAVOMcoat 1700 and MAVOMcoat 1300 were supplied by MAVOM Chemie BV, The Netherlands.
Conversion coatings and post-treatments
Conversion coatings MAVOMcoat 1700 and MAVOMcoat 1300 were deposited by immersion (dip application) of CP-AA3003 samples in the conversion bath at room temperature. A 250 ml polyethylene cup was used as a conversion bath and mixed using a magnetic stirrer at 250 rpm. After different immersion times in the conversion bath, the samples were rinsed and immersed for 1 min in Milli-Q water at room temperature and dried in a stream of nitrogen. Immediately afterwards, the samples were dried in a laboratory oven for 3 min at 100 °C.
MAVOMcoat 1700 (designated MC1700) is a Zr-based and Cr-free chemical conversion coating containing dihydrogen hexafluorozirconate. The 5 wt% MC1700 solution was prepared with Milli-Q Direct water, and pH was set to 4.4 using 15 wt% ammonium bicarbonate (NH4)HCO3 (Sigma Aldrich, Saint Louis, MO, USA).
MAVOMcoat 1300 (designated as MC1300) is a hexafluoro-zirconate type of conversion coating with the addition of trivalent chromium Cr(III). The conversion bath contained 5 wt% of MC1300 with pH=4.1 (adjusted with 25% NH3 solution, Merck, Darmstadt, Germany). The solution was prepared using Milli-Q Direct water.
According to the manufacturer’s recommendations, the suggested conversion time (tconv) for MC1700 is between 20 s and 180 s, and for MC1300, between 60 s and 600 s. In this study, for the sake of a systematic approach, various tconv were selected (from 80 s to 45 min) according to the shape of the open circuit potential (OCP) vs conversion time curves measured in conversion baths. After deposition, three post-conversion treatments were applied before electrochemical or SEM/EDS measurements: (1) samples were air-dried for 15 min (designated M1700 and MC1300), (2) samples were air-dried for 24 h (designated M1700_air and MC1300_air), and (3) samples were immersed in 3.5 wt% NaCl for 24 h (designated M1700_NaCl and MC1300_NaCl).
Characterisation
Electrochemical measurements
Electrochemical measurements were conducted in a three-electrode conventional corrosion cell (K0235 Flat Cell Kit, volume 250 ml, Metrohm Autolab, Utrecht, Netherlands) at room temperature in 3.5 wt% NaCl (99.7%, Fisher Scientific), pH∼5.5. A specimen (working electrode) was embedded in a Teflon holder with an exposed area of 1 cm2. An Ag/AgCl electrode (sat. AgCl/KCl, 0.197 V vs standard hydrogen electrode) was used as the reference electrode, and a platinum mesh served as a counter electrode. All potentials in the text are referred to the Ag/AgCl scale.
Electrochemical experiments were performed with the potentiostat/galvanostat Autolab PGSTAT 12 (Metrohm Autolab, Utrecht, Netherlands) and controlled by Nova 2.1 software. First, the linear polarisation measurements were recorded in a potential range ± 10 mV vs stable OCP, using a 0.1 mV s−1 potential scan rate. Using Nova software, the polarisation resistance (Rp) was calculated based on parameters derived from the Tafel extrapolation method in accordance with the ASTM G59–97 standard.64 After that, the potentiodynamic polarisation measurements (denoted as PD) were performed using a 1 mV/s potential starting at −250 mV vs OCP in the anodic direction until the current reached 0.1 mA. For each sample, measurements were repeated at least three times, and the most representative measurement was chosen to be presented in graphs. In tabular form, results are shown as mean ± standard deviation. The electrochemical corrosion parameters, corrosion potential (Ecorr), and corrosion current density (jcorr) were determined from polarisation curves by Tafel approximation using Nova 2.1 software. Additionally, breakdown potential (Ebd) and extent of passive range (ΔE = Ebd–Ecorr) were determined from the polarisation curves.
OCP measurements were made for selected specimens during coating formation in a polyethylene cup containing conversion bath. The exposed area of each specimen was ∼2 cm2. An Ag/AgCl electrode was employed as the reference electrode.
Surface analysis
Scanning electron microscopy (SEM) images using the back-scattered electron (BSE) signal were recorded using a JEOL JSM-7600F microscope (Peabody, MA, USA) at an acceleration voltage of 10 kV or 15 kV (for Figs. 3 and 4). The instrument is equipped with an energy-dispersive X-ray spectroscope (EDS) supplied by Oxford Instruments INCA (Abingdon, UK). Images were recorded in secondary electron (SE, lower electron imaging LEI) and back-scattered electron (BSE, Compo) modes. The selected analysed area was a few micrometres in diameter, and the analysed depth was around 1 micrometre. Analysis was performed at 10 kV and 15 kV. Before analysis, the specimens were coated with a thin carbon layer.
Selected specimens were analysed using focused ion beam SEM (FIB-SEM, FEI Helios NanoLab 650 SEM) (Figs. 7–13). Images were taken in SE mode at 5 kV. EDS spectra were recorded using an Oxford Instruments AZtec system with X-max SDD (50 mm2) detector. Before SEM analysis, samples were coated with a thin carbon layer to reduce the charging effect.
The cross sections of selected regions on the samples were obtained after the deposition of a thin layer of carbon on the surface (first, 0.2 μm thick layer was deposited using an electron beam at 2 kV and 0.8 nA, the second layer, 1 μm thick, was deposited using Ga FIB beam at 30 kV and 0.24 nA), followed by cutting the coating using Ga FIB beam at 30 kV and 0.77 nA. The surface was polished with a Ga beam at 30 kV and 83 pA in the last step. Imaging along the cross section was performed by SEM using SE mode at 5 kV.
The X-ray photoelectron spectroscopy (XPS) analyses were carried out on the PHI-TFA XPS spectrometer produced by Physical Electronics Inc., Feldkirchen, Germany. During the analysis, the vacuum was in the range of 10–9 mbar. The investigated area was 0.4 mm in diameter, and the analysed depth was about 3–5 nm. Sample surfaces were excited by X-ray radiation from a monochromatic Al source at a photon energy of 1486.6 eV. The survey wide-energy spectra were taken with a pass energy of analyser of 187 eV to identify and quantify present elements on the surface. The high-energy resolution spectra were acquired with an energy analyser operating at a resolution of about 0.6 eV and pass energy of 29 eV. XPS spectra were analysed by Multipak software, version 8.1 (Physical Electronic Inc.). During data processing, the spectra were aligned by setting the C 1s peak at 284.8 eV, characteristic of C–C/C–H bonds). Carbon as an adventitious element was not considered when calculating the surface elemental composition.
Depth profiles of the oxide layers were obtained using an Ar+ beam at a sputtering rate of 1.1 nm/min, calculated using an Al2O3 layer of known thickness deposited by atomic layer deposition.
To ensure reproducibility and account for potential heterogeneity of the conversion coatings, surface characterisation was carried out at a minimum of three distinct locations across the surface of each sample. These locations were selected to capture representative coating morphology and composition features.
Results and Discussion
The first step was optimising the conversion time for coating deposition, which ranged from 80 sec to 45 min at room temperature. During that time, the OCP of the sample was measured. After the designed conversion period, the sample was rinsed and dried. Afterwards, the samples were subject to three post-conversion routes: (1) air drying for 15 min, (2) air drying for 24 h, and (3) immersion in 3.5 wt% NaCl solution for 24 h (Fig. 1). Following the post-conversion treatment, the electrochemical measurements were conducted in 3.5 wt% NaCl. Based on the deduced electrochemical parameters (small jcorr, large Rp and broad ΔE), the optimal conversion times were selected and then used with two different post-conversion treatments (24 h air drying and 24 h immersion in 3.5 wt% NaCl). For those, SEM/EDS and XPS analyses were made to study the morphology and chemical composition of the conversion coatings formed on the AA3003 surface.
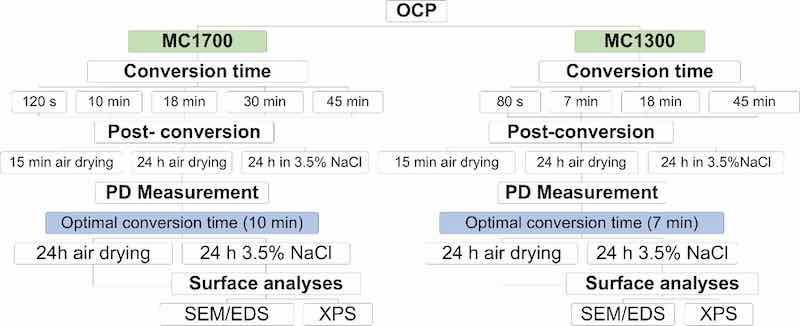
Figure 1. Schematic presentation of the procedure for conversion coating analyses.
The effect of conversion time and post-conversion treatment
The open-circuit potential was measured during immersion for 1 h in the MC1300 and MC1700 conversion baths to determine the kinetics of conversion coating formation on sample AA3003 (Fig. 2).
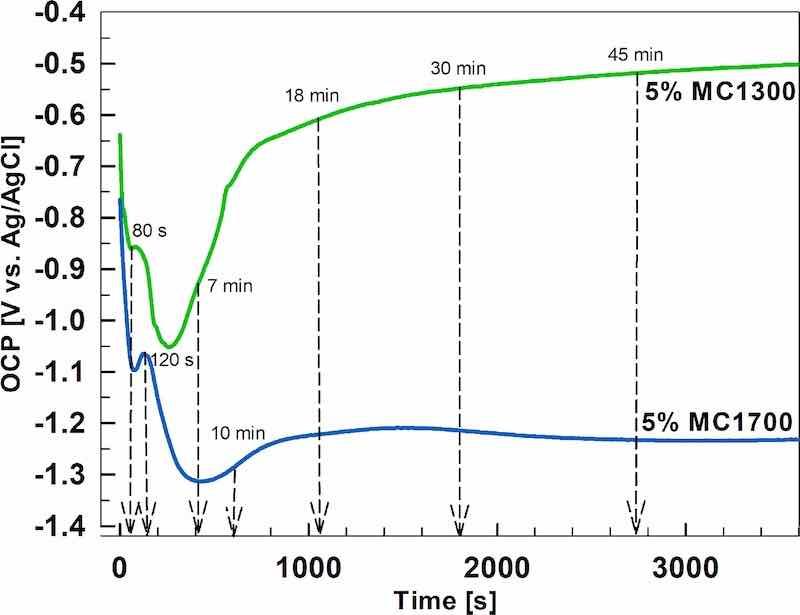
Figure 2. The dependence of the open circuit potenstial vs time during the immersion of AA3003 in MC1300 and MC1700 conversion baths at room temperature.
Upon immersion, OCP in the MC1300 bath was −0.64 V and in the MC1700 − 0.76 V. The potential decreased, forming a small peak at −0.86 V (at 59 s) for MC1300 and −1.1 V (at 79 s) for MC1700. This peak was followed by a larger decrease to minimum values of −1.05 V for MC1300 (at 263 s) and −1.31 V for MC1700 (at 437 s). The shift of OCP in the negative direction reflects the dissolution of the Al oxide layer upon immersion in the ZrCC bath of pH 4.4 and 4.1, respectively. Subsequently, the OCP curves gradually shifted to more positive values, reflecting the coating’s progressive coverage of the surface. For MC1300, OCP attained a relatively constant value of −0.5 V. In the MC1700 bath, the positive shift was lesser (≈0.1 V) than for MC1300 (≈0.55 V), and after 2000 s, the OCP was 0.66 V more negative than that of MC1300, i.e. −1.2 V. The observed more potential shift for MC1300 is likely due to the different thicknesses of the two coatings, as shown below (Figs. 3 and 4), or the effect of Cr in the coating. The latter diminishes the cathodic activity and leads to a subsequent increase in electrochemical potential.
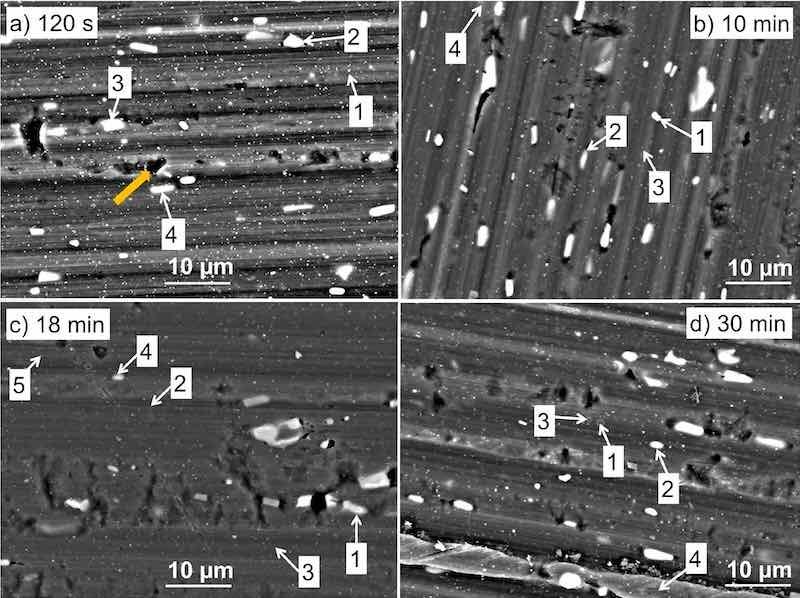
Figure 3. SEM back-scattered electron micrographs of AA3003 samples coated with MC1700 conversion coatings prepared with different conversion times: (a) 120 s, (b) 10 min, (c) 18 min, and (d) 30 min. The enumerated spots are the locations where EDS analysis was performed (Table I). BSE images were taken at an acceleration voltage of 15 kV. The arrow in (a) denotes the defect in the material. The SEM images recorded in LEI mode and images for bare and chemically treated samples are given in Fig. S1.
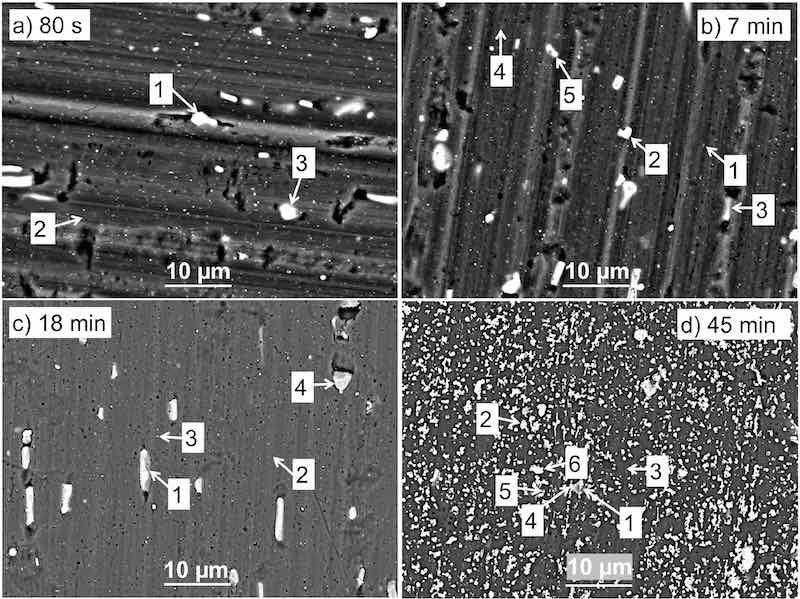
Figure 4. SEM back-scattered electron micrographs of AA3003 coated with MC1300 conversion coatings prepared with different conversion times: (a) 80 s, (b) 7 min, (c) 18 min, and (d) 45 min. The enumerated spots are the locations where EDS analysis was performed (Table II). BSE images (a) and (b) were taken at an acceleration voltage of 15 kV, (c) and (d) at 10 kV. The SEM images recorded in LEI mode are given in Fig. S2.
The shapes of OCP curves reflect the processes occurring in the conversion bath during the coating formation on the AA3003 sample. In the first stage, when the potential drops to a minimum value, the naturally formed aluminium oxide layer begins to dissolve due to the attack of fluoride species from ZrF62−-containing bath.23,35,44,51,65,66 At the same time, oxygen reduction and hydrogen evolution reactions occur at cathodic sites and lead to local alkalisation up to pH = 8.5 near cathodic sites.44 This establishes the conditions required for the deposition of Zr-hydroxide (Eq. 1), a pH-driven process.44,51,57
ZrF[2/6(aq)]- + 4OH-aq → ZrO2 • 2H2O(s) + 6F-(aq) [1]
At the minimum potential, natural oxide dissolution and deposition coating formation are in balance. When the OCP shifts less negative, the growth of conversion coating increases over film dissolution. A plateau reached at longer conversion times indicates that the deposition process becomes dominant over dissolution, resulting in more extensive conversion coating coverage. At longer immersion times, the conversion coating continues to grow, but due to the increase in thickness, cracking of the coating results in a loss of protection.55,67,68
Based on the OCP measurements (Fig. 2), the conversion times of 80 s, 7 min, 18 min and 45 min for MC1300 and 120 s, 10 min, 18 min, 30 min and 45 min (only for PD measurement) for MC1700 were selected for initial SEM/EDS and electrochemical measurements. SEM/EDS analysis will be considered first.
Figure 3 shows the BSE images of the morphology of CP-AA3003 samples coated with MC1700 conversion coatings prepared at different conversion times and then air-dried for 15 min. At 120 s conversion time (Fig. 3a), many smaller and somewhat larger bright particles existed. Only the matrix was detected in location (1) (Table I). Larger bright particles, sized around 3.5 μm, are intermetallic particles (IMPs), mainly Al(Mn,Fe) in location (2), Al(Mn,Fe)Si in location (3) and Al(Mn,Fe)Si,Cu in location (4)). No deposition of Zr or F was identified at any of the spots at the surface using the given EDS analysis parameters.
Table I. The concentrations of elements obtained by EDS analysis of CP-AA3003 coated with MC1700 conversion coatings prepared at different conversion times for MC1700 (Fig. 3). Notation “m” in the first column denotes the matrix. For quantification, please refer to the footnote.a)
| Location | Conversion time | O | Al | Mn | Fe | Si | Zr | F | Cu |
| 1 m | 120 s (Fig. 3a) | <1 | 99 | 0.7 | — | — | — | — | — |
| 2 | 1 | 79 | 11.4 | 8.6 | — | — | — | — | |
| 3 | <1 | 77 | 11.2 | 7.6 | 3.4 | — | — | — | |
| 4 | 1 | 69 | 13.6 | 11.3 | 4.7 | — | — | 0.3 | |
| 1 | 10 min (Fig. 3b) | 1 | 83 | 8.6 | 3.2 | 3.0 | 0.8 | <1 | — |
| 2 | 1 | 82 | 9.0 | 7.1 | — | 0.5 | — | 0.3 | |
| 3 m | 1 | 98 | 0.3 | — | — | 0.6 | — | — | |
| 4 | 2 | 90 | 2.6 | 2.1 | — | 3.0 | <1 | 0.2 | |
| 1 | 18 min (Fig. 3c) | 2 | 79 | 7.1 | 9.6 | — | 1.7 | — | 0.6 |
| 2 | 1 | 96 | 0.7 | 0.5 | — | 0.9 | <1 | — | |
| 3 m | 1 | 97 | 0.3 | — | — | 0.8 | — | — | |
| 4 | 2 | 80 | 7.6 | 6.6 | 2.9 | 1.1 | — | 0.4 | |
| 5 m | 1 | 96 | 0.6 | — | — | 0.9 | <1 | 0.3 | |
| 1 | 30 min (Fig. 3d) | 2 | 94 | 0.3 | 0.2 | — | 3.3 | <1 | — |
| 2 | 2 | 78 | 9.7 | 7.9 | — | 2.0 | — | 0.3 | |
| 3 m | 2 | 95 | 0.4 | — | — | 2.8 | <1 | — | |
| 4 | 1 | 94 | 1.1 | 0.7 | — | 1.6 | <1 | 0.3 |
a)In EDS; detection limits are typically considered to be ≥1% for low atomic number elements (F to Be) and ≥0.1% (1000 ppm) for higher atomic number elements. With standardless quantitative EDS; which is most often used; relative errors may be ±2% to ±5% for major components (https://www.jeolusa.com). Accordingly; in the tables; concentrations for light elements (O and F) were rounded to 1 at%; as well as for Al as a major element coming from the substrate.
For comparison, SEM images of bare AA3003 samples cleaned using nitric acid and alkaline cleaning agents and nitric acid are presented in Fig. S1. In addition to the matrix and intermetallic particles, several round or irregular defects were visible (noted in Fig. 3a with arrow). The comparison of the pristine sample and after chemical cleaning shows no particular difference in the number of these defects, which seem to be related to the fabrication.
However, after 10 min of immersion in MC1700 (Fig. 3b), Zr and F were identified (Table I), confirming that the conversion time is decisive in the deposition process. The content of Zr ranged from 0.5 to 3 at%, and F was below 1 at%, depending on the location at the surface. Three IMPs were analysed: (1) Al(Mn,Fe)Si, (2) Al(Mn,Fe), and (4) Al(Mn,Fe)Cu. Among these IMPs, the latter had the highest Zr content (3 at%), probably reflecting the highest electrochemical activity of this IMP containing Cu. At this spot, the concentration of O also increased. Compared to the conversion time of 120 s, smaller concentrations of Mn, Fe and Si on IMPs were detected due to their coverage with the coating. The increase of O, Zr and F is attributed to the formation of Zr conversion coating, which contains both oxide and fluoride, as has already been observed.56 The fluoride content is smaller than that of oxygen. The deposition of ZrCC was not limited to IMPs but extended throughout the surface since Zr was also detected at the matrix (location (3)).
Prolongation of conversion time to 18 min (Fig. 3c) generally led to a slight increase in Zr content. Copper was detected on IMPs (1), (4), and (5), where Zr contents were more expressed. At locations (2) and (5), F was detected. Locations (3) and (5) refer to the alloy matrix, which Zr coating also covered. The fact that scratches and grooves were less visible after 18 min than after 120 s and 10 min of conversion confirms that the coating formed during 18 min is thicker, as reflected below by electrochemical measurements (Fig. 6 and S3).
After 30 min of conversion (Fig. 3d), more surface defects (denoted by black holes) were observed on the surface, and the coating appeared more etched. The differences in surface morphology are more clearly visible in the SE SEM images (Fig. S1), where they appear as pronounced dark features aligned with the rolling direction. Nevertheless, the concentration of Zr and F was highest at this conversion time. Notably, for all samples, the concentration of Al was relatively high because the small thickness of the coating allowed the detection of the underlying substrate when using the EDS technique with micrometre-large depth analysis. Due to this interaction volume and the resulting signal overlap between the coating and substrate, the reported elemental concentrations should be considered as semi-quantitative estimates.a
Figure 4 shows the SEM micrographs of the surface morphology of AA3003 specimens after 80 s, 7 min, 18 min and 45 min immersion time in MC1300. The corresponding EDS analysis of numbered locations is given in Table II.
Table II. The concentrations of elements obtained by EDS analysis of CP-AA3003 coated with MC1300 conversion coatings prepared at different conversion times (Fig. 4). Notation “m” in the first column denotes the matrix. For quantification, please refer to the footnote.a
| Location | Conversion time | O | Al | Mn | Fe | Si | Cr | Zr | F | Cu |
| 1 | 80 s (Fig. 4a) | 1 | 76 | 10.9 | 10.9 | 0.1 | — | — | — | 0.4 |
| 2 m | <1 | 99 | 0.4 | — | — | — | — | — | — | |
| 3 | <1 | 79 | 9.9 | 10.2 | — | — | — | — | 0.5 | |
| 1 m | 7 min (Fig. 4b) | <1 | 99 | 0.5 | — | — | — | — | — | 0.2 |
| 2 | <1 | 82 | 8.4 | 6.3 | 2.6 | — | — | — | 0.3 | |
| 3 | 1 | 67 | 15.1 | 11.0 | 5.2 | — | 0.6 | — | 0.4 | |
| 4 | 2 | 94 | 0.8 | 0.3 | 0.2 | 0.3 | 1.9 | — | — | |
| 5 | 6 | 73 | — | — | 7.7 | — | 11.0 | 3 | — | |
| 1 | 18 min (Fig. 4c) | 14 | 43 | 5.9 | 5.1 | — | 5.1 | 23.9 | 3 | — |
| 2 m | <1 | 99 | — | — | — | — | — | — | — | |
| 3 | 4 | 82 | 5.6 | 2.3 | 1.2 | — | 4.1 | <1 | — | |
| 4 | 3 | 72 | 12.4 | 8.4 | — | — | 2.8 | — | 0.5 | |
| 1 | 45 min (Fig. 4d) | 5 | 72 | 11.3 | 3.2 | — | 1.3 | 5.1 | 2 | — |
| 2 m | 10 | 61 | — | — | — | 5.2 | 19.6 | 4 | — | |
| 3 m | <1 | 99 | — | — | — | — | — | — | — | |
| 4 | 13 | 48 | 5.9 | — | 1.0 | 5.1 | 21.3 | 6 | — | |
| 5 m | 11 | 62 | 1.5 | — | — | 5.0 | 17.4 | 3 | — | |
| 6 | 10 | 47 | 9.3 | 6.8 | 3.5 | 3.1 | 16.1 | 4 | — |
For the shortest conversion time (80 s) of MC1300 (Fig. 4a), the results show similar behaviour as with the conversion coating MC1700 at 120 s (Fig. 3a). No conversion coating was detected using EDS (Table II).
After 7 min of immersion in the MC1300 bath, the presence of Zr was detected on locations (3)−(5) (Fig. 4b). Cr was detected only on IMP (4) Al(Mn,Fe)Si. The highest content of Zr (11 at%) was detected at location (5), where also F was present (Table II). The detected concentrations of Zr, Cr, and F confirm the formation of a conversion coating on the surface of IMPs but not on the matrix (location (1)).
After 18 min, significantly higher concentrations of Zr, Cr, F, and O were detected on IMP (1) (Fig. 4c), extending to 24 at% Zr, 5 at% Cr and 3 at% F. At IMPs (3) and (4), less Zr and no Cr were detected.
After 45 min of conversion time, the overall values of Zr, Cr, F, and O were higher compared to shorter conversion periods (Fig. 4d, Table II). Particle agglomeration was observed, indicating that the conversion coating is no longer evenly distributed on the surface.
Subsequently, electrochemical measurements in 3.5 wt% NaCl were conducted for bare-AA3003, CP-AA3003, MC1700- and MC1300-coated CP-AA3003 samples prepared at various conversion times and then subjected to three post-treatments: air drying for 15 min, air drying for 24 h, and immersion in NaCl solution for 24 h. As will be shown, polarisation measurements reflect the differences in the corrosion protective ability of the coated samples only after prolonged immersion in NaCl solution. The potentiodynamic polarisation curves measured in 3.5 wt% NaCl for all samples are provided in the Supplementary material, together with the deduced electrochemical parameters given as mean values and standard deviations (Figs S3 and S4, Tables S1 and S2). Polarisation curves for selected specimens will be described in more detail in the next section. For a more accessible presentation of the results, the main electrochemical parameters (Rp, jcorr and ΔE) are herein presented in Fig. 5. The conversion time and type of post-conversion treatment have a decisive effect on the electrochemical response for the non-coated and coated samples (Figs. S3 and S4). Figures 5a, 5c, 5e exhibit the electrochemical parameters for MC1700 samples prepared for different conversion times and post-treated by air drying and immersion in NaCl. Values of Rp, jcorr and ΔE for chemically pre-treated substrate (without coating) and subjected to the same post-treatments are given at the ordinate axes.
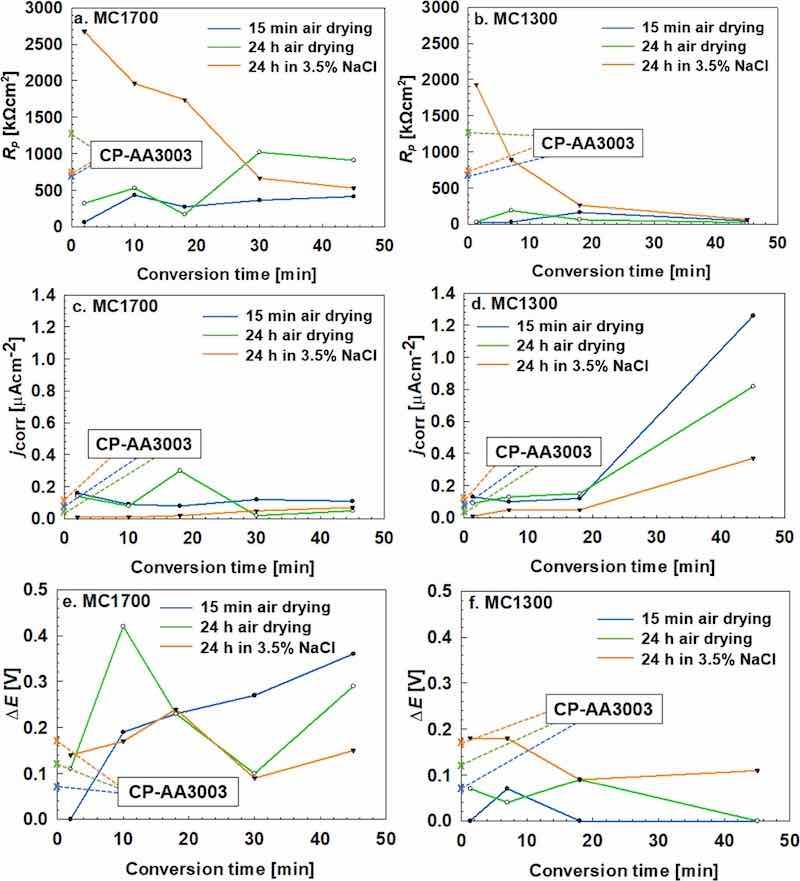
Figure 5. Variation of the (a, b) polarisation resistance (Rp), (c, d) corrosion current density (jcorr) and (e, f) extent of passive range (ΔE) with conversion time for (a, c, e) MC1700 and (b, d, f) MC1300 in 3.5 wt% NaCl. Before measurements, the samples were air-dried for 15 min and 24 h and immersed for 24 h in 3.5 wt% NaCl. The presented values are mean values; please refer to Tables S1 and S2 for standard deviations. Values of Rp, jcorr and ΔE for chemically pre-treated substrate (without coating) and subjected to the same post-treatments are given at the ordinate axes.
Let us first consider air-dried samples. Compared to CP-AA3003, all coated samples exhibited smaller Rp and higher jcorr. However, ΔE values for samples prepared at tconv > 120 s (Fig. 5e) are much larger than for non-coated samples, probably related to the increased thickness of the coating (Fig. 3). Therefore, comparing only Rp and jcorr of coated samples with uncoated ones does not reflect any improvement in the corrosion behaviour brought by the coating. However, when considering ΔE, the beneficial effect is evidenced.
The effect of tconv is also reflected mainly in ΔE parameter. The general conclusion may be that after a shorter tconv of 10 min, prolonged air drying of 24 h is beneficial, resulting primarily in a broader ΔE region and higher Rp. For longer tconv, Rp increased further, but ΔE region narrowed. It seems, however, that prolonged air drying significantly affects the non-coated substrate as well; for example, Rp for CP-AA3003 increased twofold after 24 h air drying (from 628 to approximately 1300 kohm cm2) and ΔE from 70 mV to 120 mV. This probably results from the thickening and densifying of the Al oxide layer during air drying, which occurs within the pores of the coated samples or non-coated areas, thus contributing to the improvement of electrochemical parameters. The beneficial effect of prolonged air drying was observed on TCP-coated AA202458 and our previous study on ZrCC on AA5754.39 Although EDS did not identify Zr or F for tconv of 120 s (Fig. 3a, Table I), the electrochemical response (Figs. 5, 6 and A1) confirms the change compared to the non-coated substrate, indicating that the coating was present at the surface. This apparent discrepancy can be explained by the thickness of the coating being too small to be detected by EDS analysis.
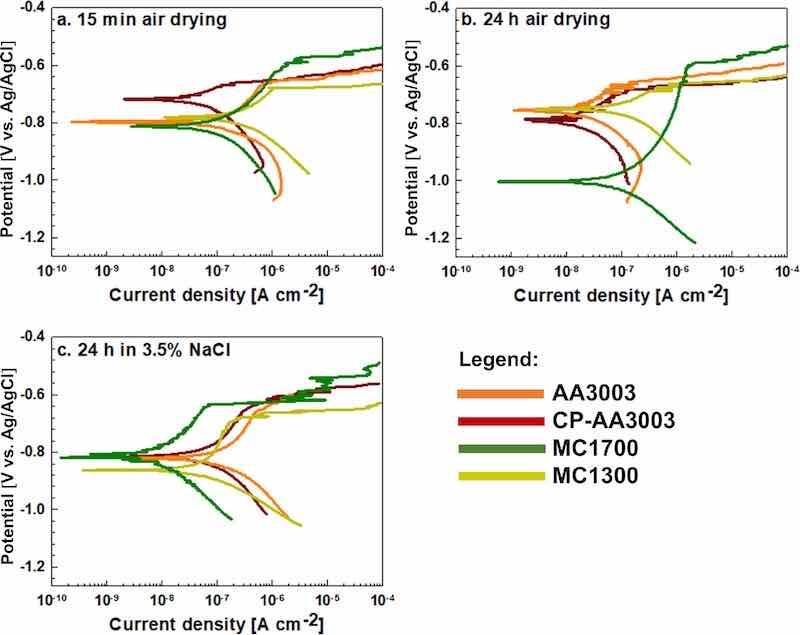
Figure 6. Potentiodynamic polarisation curves recorded for uncoated AA3003, chemically pre-treated (CP-AA3003) and coated with MC1300 (tconv = 7 min) and MC1700 (tconv = 10 min) coatings at room temperature. The curves were recorded in a 3.5 wt% NaCl solution. Before PD measurements, the samples were (a) air-dried for 15 min, (b) air-dried for 24 h and (c) immersed for 24 h in 3.5 wt% NaCl. The scan rate was 1 mV s−1. Electrochemical parameters deduced from the curves are presented in Table III.
The beneficial effect of conversion treatment is evidenced primarily after prolonged immersion in 3.5 wt% NaCl since all electrochemical parameters of the coated samples are now superior to non-coated samples. After immersion in NaCl, Rp values of MC1700-AA3003 samples were almost 4 times larger than those of immersed CP-AA3003 and also larger than MC1700-coated samples dried in air (Fig. 5a). This is valid for MC1700 coatings prepared at shorter tconv, up to 18 min. For samples of tconv >18 min, Rp progressively decreased to 530 kohm cm2, indicating that longer tconv did not provide adequate protection. The effect of tconv is also well evidenced in the trend of jcorr and ΔE (Figs. 5c,5d). After immersion in NaCl, jcorr values of coated samples prepared at tconv up to 18 min were lower than those on non-coated samples subject to the same treatment. ΔE values showed a similar trend.
It seems that the efficiency of protection cannot be regarded by only one electrochemical parameter but is an interplay of all three parameters: Rp, jcorr and ΔE. Rp seems to be a more suitable evaluation parameter than jcorr, as already pointed out in our previous studies by Kraš et al.38,39 ΔE is an additional representative parameter. Also, measuring polarisation curves in 3.5 wt% NaCl immediately after preparation or even after prolonged drying does not necessarily reflect the protective ability of the prepared coatings. The results show that more relevant information on the protectiveness of coated samples can be obtained after prolonged immersion in 3.5 wt% NaCl.
Results for MC1300 are presented in Figs. 5b, 5d, 5f. A similar trend to MC1700 samples was observed. Samples subjected to short conversion time exhibited higher Rp after immersion in NaCl than after air drying and considerably higher than for non-coated samples. The electrochemical response registered the effect of the coating prepared at tconv of 80 s, although it was not detectable by EDS (Fig. 4a, Table II). If the conversion time was longer, the Rp dropped significantly and was eventually similar for all coated samples and smaller than for non-coated ones (Fig. 5b). Larger differences were observed in jcorr (Fig. 5d), where smaller jcorr were measured for shorter conversion times. Again, the coated samples immersed in NaCl exhibited significantly lower jcorr values than non-coated samples, which was not the case when the coated samples experienced only 15 min air drying. For tconv > 18 min, all coated samples showed deteriorated behaviour. A reduction of ΔE was observed for tconv > 7 min (Fig. 5f) regardless of the post-treatment.
Based on the deduced electrochemical parameters (small jcorr, large Rp, the widest ΔE) for samples prepared at different conversion times (Figs. 5, S3 and S4) and results of SEM/EDS analyses (Figs. 3, 4), the following parameters were selected as the appropriate conversion coating treatment: immersion time of 10 min for MC1700 and 7 min for MC1300. Although the electrochemical parameters (small jcorr, large Rp) were adequate even for the shortest conversion time (120 s for MC1700 and 80 s for MC1300), complementary SEM analysis (Figs. 3 and 4 and Tables I and II) showed no detectable Zr signal, which is typically indicative of the presence of a conversion coating. Therefore, it was assumed that the coating formed under these conditions was either absent or too thin to be reliably detected by EDS and, thus, not considered sufficient for efficient protection. In contrast, electrochemical parameters for the coatings prepared at longer conversion times (> 10 min) showed poor corrosion resistance (larger jcorr, smaller Rp) (Fig. 5).
Potentiodynamic polarisation curves for bare and CP-A3003 samples and samples coated with two selected coatings and three post-conversion treatments are shown in Fig. 6. Electrochemical parameters deduced from these curves are given in Table III.
Table III. Electrochemical parameters were deduced from potentiodynamic measurements in 3.5 wt% NaCl for uncoated AA3003, chemically pre-treated (CP-AA3003) and coated with MC1300 (tconv = 7 min) and MC1700 (tconv = 10 min) coatings. The polarisation resistance (Rp) was determined from linear the polarisation measurements, and the corrosion potential (Ecorr), corrosion current density (jcorr), breakdown potential (Ebd) and ΔE = |Ebd - Ecorr| from potentiodynamic polarisation curves (Fig. 6). Values are given as mean ± standard deviation.
| Post- treatment | Sample | OCP (V) | Rp (kΩ cm2) | Ecorr (V) | jcorr (μA cm−2) | Ebd (V) | ΔE (V) |
| 15 min air drying | AA3003 | −0.82 ± 0.02 | 560 ± 50 | −0.78 ± 0.01 | 0.1 ± 0.04 | −0.66 ± 0.04 | 0.12 ± 0.01 |
| CP-AA3003 | −0.77 ± 0.05 | 680 ± 90 | −0.74 ± 0.03 | 0.04 ± 0.03 | −0.67 ± 0.01 | 0.07 ± 0.02 | |
| MC1300 | −0.71 ± 0.03 | 30 ± 4 | −0.75 ± 0.05 | 0.1 ± 0.08 | −0.68 ± 0.01 | 0.07 ± 0.03 | |
| MC1700 | −0.77 ± 0.05 | 430 ± 10 | −0.78 ± 0.05 | 0.09 ± 0.01 | −0.59 ± 0.01 | 0.19 ± 0.04 | |
| 24 h air drying | AA3003 | −0.83 ± 0.03 | 1400 ± 300 | −0.74 ± 0.03 | 0.04 ± 0.02 | −0.66 ± 0.01 | 0.09 ± 0.02 |
| CP-AA3003 | −0.78 ± 0.02 | 1300 ± 200 | −0.80 ± 0.01 | 0.02 ± 0.01 | −0.68 ± 0.01 | 0.12 ± 0.01 | |
| MC1300 | −0.70 ± 0.03 | 190 ± 40 | −0.72 ± 0.04 | 0.13 ± 0.11 | −0.68 ± 0.02 | 0.04 ± 0.02 | |
| MC1700 | −0.98 ± 0.01 | 530 ± 60 | −1.01 ± 0.01 | 0.08 ± 0.01 | −0.59 ± 0.02 | 0.42 ± 0.02 | |
| 24 h immersion in 3.5% NaCl | AA3003 | −0.77 ± 0.02 | 320 ± 120 | −0.81 ± 0.02 | 0.1 ± 0.03 | −0.63 ± 0.05 | 0.18 ± 0.03 |
| CP-AA3003 | −0.76 ± 0.01 | 740 ± 50 | −0.82 ± 0.02 | 0.06 ± 0.03 | −0.64 ± 0.02 | 0.17 ± 0.04 | |
| MC1300 | −0.82 ± 0.01 | 890 ± 70 | −0.86 ± 0.01 | 0.05 ± 0.01 | −0.67 ± 0.01 | 0.18 ± 0.02 | |
| MC1700 | −0.77 ± 0.04 | 2000 ± 500 | −0.80 ± 0.02 | 0.01 ± 0.03 | −0.63 ± 0.01 | 0.17 ± 0.01 |
First, the effect of post-treatment is discussed for non-coated A3003 samples. The polarisation curve for bare-AA3003 shows a relatively good corrosion resistance with jcorr of 0.1 μA cm−2 and ΔE of 0.12 V (Figs. 6a and S3, Table III). CP-AA3003 exhibited lower jcorr and more positive Ecorr measured after 15 min air drying. The improvement in corrosion parameters results from removing the naturally formed oxide layer and subsequent passivation in nitric acid. Ebd was similar for both samples. If the samples were dried in air for 24 h before measurement (Fig. 6b), the Ecorr for bare-AA3003 shifted positively (from −0.78 to −0.74 V) in contrast to the CP-AA3003, which moved in the negative direction (from −0.74 to −0.80 V). This led to expanding the ΔE value for CP-AA3003 from 70 to 120 mV. The jcorr of both samples was smaller and Rp higher compared to shorter air drying time.
After 24 h immersion in 3.5 wt% NaCl, the potentiodynamic polarisation curves for bare- and CP-AA3003 had similar shapes (Fig. 6c) but with wider ΔE and higher jcorr values than 24 h air drying. As mentioned above, prolonged drying in air beneficially affects the corrosion resistance of AA3003, presumably due to the thickening or densifying of the surface layer. However, after 24 h of immersion in 3.5 wt% NaCl, the curves still showed the extended passive range but, at the same time, exhibited higher current densities. Therefore, the corrosion resistance of AA3003 was jeopardised.
The deposition of the conversion coatings on CP-AA3003 changed the polarisation response. When the polarisation curves of the coated samples were measured after only 15 min air drying, the response was similar to bare-AA3003 (Fig. 6a). The jcorr values were around 0.1 μA cm−2 (Table III). Both coated samples exhibited larger jcorr and smaller Rp than CP-AA3003, but the curves for coated samples shifted negatively, resulting in the extended ΔE. The curve for MC1700 exhibited the widest ∆E window among the samples.
If the samples were air-dried for 24 h before the PD measurement (Fig. 6b), the main difference was for the MC1700, where Ecorr became more negative (−1.01 V), resulting in an increase of ΔE from 190 to 420 mV (Table III). This indicates that the coating MC1700 provided better cathodic than anodic inhibition after air drying. However, Rp was smaller and jcorr larger than bare- and CP-AA3003. For the sample coated with MC1300, the prolonged air drying did not significantly improve the corrosion behaviour compared to CP-AA3003.
The corrosion behaviour of non-coated and coated samples was also evaluated after 24 h of immersion in 3.5 wt% NaCl (Fig. 6c). Compared with the results after 24 h air drying (Fig. 6b), both curves for non-coated samples shifted towards higher current densities and more negative potentials, indicating the dissolution of the surface oxide layer. In contrast, coated samples shifted towards smaller current densities and exhibited similar Ecorr (between −0.80 V and −0.86 V) and ΔE (170–180 mV). Therefore, immersion in NaCl resulted in a strong shift of the MC1700-coated sample to more positive potentials and smaller current densities, indicating a change of predominantly cathodic inhibition to anodic inhibition (Table III). In contrast, the polarisation curve for the MC1300-coated sample shifted in a more negative direction, thus significantly increasing ΔE. When judging the inhibition efficiency between the MC1700 and MC1300 coatings, the former performed better regardless of the post-conversion treatment, but especially after 24 h immersion in NaCl. As discussed in the above text, 24 h of immersion in NaCl gave the most relevant information on the degree of corrosion protection offered by MC1700 and MC1300 when deposited on CP-AA3003. Polarisation measurements immediately after coating preparation (15 min air drying) or even after prolonged air drying (24 h) did not realistically reflect the degree of corrosion protection. It seems, therefore, that the metal surface covered by a thin conversion coating is a dynamic system subject to oxide thickening and densifying during the post-preparation period. Further, potentiodynamic polarisation measurements may be too destructive for such thin layers. Performing separate anodic and cathodic scans from the OCP would likely have provided more reliable results and should be considered in future studies. Moreover, reporting corrosion protectiveness based only on the potentiodynamic measurements immediately after the coating preparation may bring false results.
SEM-EDS characterisation for non-coated substrate and selected conversion coatings
Figures 7–9 show SEM images of surface morphology and microstructure of bare- AA3003, CP-AA3003 and CP-AA3003 samples coated with MC1700 and MC1300 after 24 h post-treatments in air and 3.5 wt% NaCl. Additional data are given in the Supplementary materials (Figs. S5–S8).
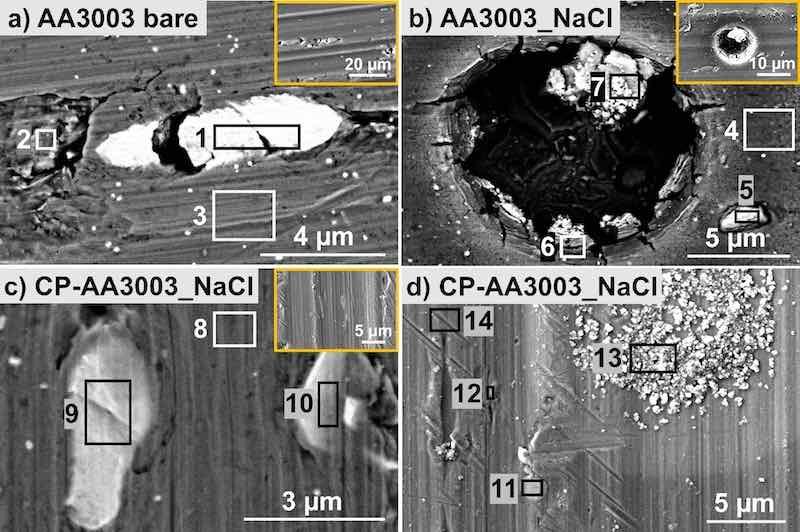
Figure 7. SEM images of (a) non-treated bare AA3003 (BSE image), (b) bare AA3003 (BSE image) and (c, d) chemically pre-treated AA3003 (CP-AA3003) immersed for 24 h in 3.5 wt% NaCl. (c) BSE image, (d) SE image.
The microstructural characteristics of AA3003 were reported in detail in our previous study.56 The main intermetallic particles are at location (1) Al(Mn,Fe) with a Mn/Fe ratio of around 1, and location (2) Al(Fe, Mn)Si with a Mn/Fe ratio of 4.4 and Si/Fe of 2.4 (Fig. 7a, Table IV). Location (3) represents the alloy matrix. After 24 h of immersion in 3.5 wt% NaCl sample AA3003 exhibited pits and cracks (Fig. 7b). The content of O increased compared to bare alloy and was the largest at locations (5) and (6), reflecting the abundant formation of corrosion products. The former refers to Mn-Fe-rich IMP, and the latter to the pit’s edge, where Zn and Cl were detected. At location (7), an Al(Fe, Mn)Si IMP, Zn, Cl and Cu were identified. In contrast, no chlorine was detected at the matrix location (4). The results indicate that zinc on the surface promotes corrosion when the AA3003 sample is immersed in 24 h in 3.5 wt% NaCl. These results are consistent with those reported by Šekularac et al.69
Table IV. EDS analysis of non-treated bare AA3003 and bare AA3003 and CP-AA3003 after immersion for 24 h in 3.5 wt% NaCl (Fig. 7). Notation “m” in the first column denotes the matrix. For quantification, please refer to the footnote.a
| Location | Sample | O | Al | Mn | Fe | Si | Cu | Cl | Zn | Mn/Fe |
| 1 | AA3003 bare | 2 | 84 | 6.4 | 6.9 | — | 0.4 | — | — | 0.9 |
| 2 | 3 | 93 | 2.2 | 0.5 | 1.2 | — | — | — | 4.4 | |
| 3 m | 1 | 99 | 0.3 | — | — | — | — | — | — | |
| 4 m | AA3003_NaCl | 9 | 91 | — | — | — | — | — | — | — |
| 5 | 36 | 42 | 5.6 | 9.3 | 6.5 | — | — | — | 0.6 | |
| 6 m | 67 | 34 | — | — | — | — | 1.3 | 0.5 | — | |
| 7 | 57 | 12 | 8.6 | 16.9 | 2.6 | 1.3 | <0.5 | 1.4 | 0.5 | |
| 8 m | CP-AA3003_NaCl | 5 | 95 | — | — | — | — | — | — | — |
| 9 | 5 | 77 | 11.5 | 6.0 | — | — | — | — | 1.9 | |
| 10 | 5 | 76 | 8.6 | 5.4 | 4.8 | — | — | — | 1.6 | |
| 11 | 7 | 77 | 9.0 | 6.9 | — | — | — | — | 1.3 | |
| 12 | 6 | 80 | 7.8 | 6.5 | — | — | — | — | 1.2 | |
| 13 | 27 | 54 | — | — | 19.7 | — | — | — | — | |
| 14 m | 4 | 95 | — | — | — | — | — | — | — |
The subsequent analysis revealed that in contrast to the bare sample, chemically pre-treated AA3003 exhibited no discernible corrosion products or corrosion pits after 24 h of immersion in 3.5 wt% NaCl (Figs. 7c, 7d). Locations (8) and (14) refer to the matrix (Table IV). The bright, 4.4 μm long pear-shaped particle at location (9) represents an IMP Al(Mn, Fe), while an IMP Al(Mn, Fe)Si was detected at location (10). The O content at all presented locations (8–10) in Figs. 7c and 11, 12 and 14 in Fig. 7d is low and comparable to the oxygen content of the unexposed sample AA3003. location (13) corresponds to the formation of Al oxide at the spot rich in Si (Fig. 7d, Table IV).
The SEM images in Figs. 8a and 8b show the surface of MC1700 coating after 24 h of drying in air. The presence of the coating is evident since the surface is much less rough, and IMPs are coated compared to bare alloy in Fig. 7a. Locations (1), (2), (4), (6) and (7) belong to the matrix, exhibiting from 9 to 15 at% of oxygen (Table V), and coexistence of Zr, P, and F, in proportions of about 2 to 3 at% for Zr, about 1 to 2 at% of P, and about 1 to 2 at% of F, respectively. Phosphorus probably originates from the additives in the conversion bath.
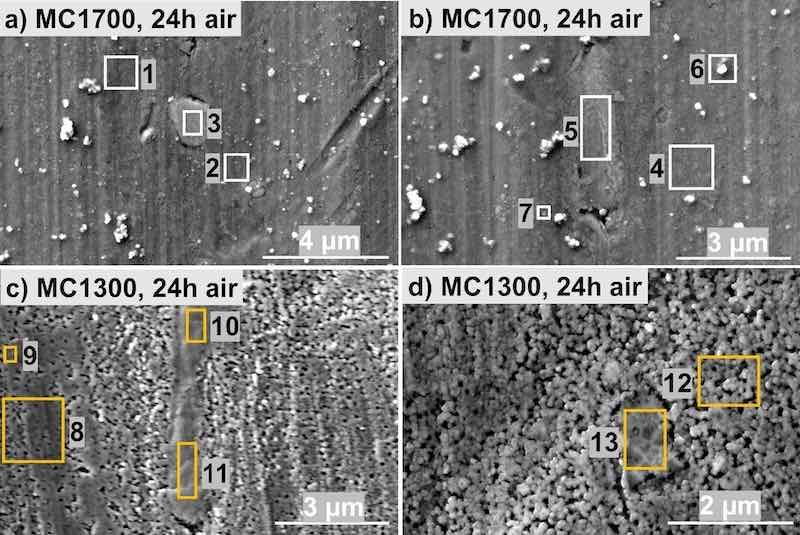
Figure 8. SEM SE images of (a, b) MC1700 and (c, d) MC1300 coated CP-AA3003. The conversion times were 10 min for MC1700 and 7 min for MC1300. After deposition, samples were dried for 24 h in the air. BSE images are given in Figs. S5 and S6. EDS analysis was made at the enumerated sites, and the results are given in Table V.
Table V. EDS analysis of MC1700 and MC1300 coated AA3003 after 24 h drying in the air (Fig. 8). Notation “m” in the first column denotes the matrix. For quantification, please refer to the footnote.a
| Location | Sample | O | Al | Mn | Fe | Si | Zr | P | F | Cu | Cr | N | K | Mn/Fe |
| 1 m | MC1700_air | 10 | 84 | — | — | — | 2.6 | 1.8 | 1 | — | — | — | — | — |
| 2 m | 9 | 87 | — | — | — | 1.9 | 1.1 | 1 | — | — | — | — | — | |
| 3 | 13 | 55 | 9.4 | 9.8 | 5.7 | 3.3 | 1.3 | 2 | — | — | — | — | 0.96 | |
| 4 m | 13 | 82 | — | — | — | 2.4 | 1.3 | 1 | — | — | — | — | — | |
| 5 | 11 | 69 | 6.9 | 6.8 | — | 3.1 | — | 1 | 0.4 | — | — | 1.7 | 1.0 | |
| 6 m | 15 | 79 | — | — | — | 2.5 | 1.8 | 2 | — | — | — | — | — | |
| 7 m | 11 | 84 | — | — | — | 2.4 | 1.4 | 1 | — | — | — | — | — | |
| 8 m | MC1300_air | 5 | 93 | 0.4 | — | — | 0.6 | — | <1 | — | 0.3 | — | — | — |
| 9 | 10 | 82 | 2.6 | 1.0 | — | 2.3 | — | 1 | — | 0.6 | — | — | 2.6 | |
| 10 | 28 | 44 | 6.2 | 5.2 | — | 6.6 | — | 5 | — | 2.6 | 1.7 | — | 1.2 | |
| 11 | 28 | 49 | 3.1 | 5.7 | — | 6.6 | — | 6 | — | 2.1 | — | — | 0.5 | |
| 12 m | 4 | 95 | — | — | — | — | — | 1 | — | — | — | — | — | |
| 13 | 36 | 38 | 3.0 | 1.5 | — | 10.5 | — | 5 | — | 4.2 | 2.1 | — | 2.0 |
Notably, a larger grey particle at location (3) is identified as an Al(Mn,Fe)Si IMP. The concentration of Zr (about 3 at%) in this IMP is somewhat greater than in the matrix. A 4.2-micrometre-long, lighter particle at location (5) (Fig. 8b, Table V) corresponds to an IMP Al(Fe, Mn) with a Zr concentration of 3 at%. In addition to F (1 at%), Cu (originated from substrate) and K (originated from conversion coating) were also present. The presented EDS analysis results indicate that the conversion layer MC1700 completely covers the entire surface, encompassing both the matrix and the IMP particles. The concentration of Al is smaller at the IMPs due to the thicker conversion layer than at the matrix.
The SEM images in Figs. 8c and 8d show the surface of MC1300 coating after 24 h of drying in air. The morphology of the two coatings differs: MC1700 exhibits more fine nodular morphology, with nodules sized between 20 and 50 nm (Figs. 8a, 8b). MC1300 exhibits coarser morphology with grain size around 150 nm; at IMPs, grains are fused, forming a homogeneous layer, whereas, at the surrounding matrix, it seems the granular morphology is more pronounced (Figs. 8c, 8d). Locations (8) and (12) belong to the matrix with no or only low concentrations of Zr and Cr. An increase in signal intensities is observed for Zr, O, and Cr at the Fe-rich sites in locations (10), (11), and (13) compared to other locations. The Fe-rich IMPs also exhibit an elevated F signal intensity. This enrichment is likely due to the susceptibility of Fe to Fˉ attack during MC1300 bath immersion. In their study, Frankel et al. similarly found that when investigating the mechanism of formation of TCP immersion coating on AA2024.58 The O and F concentrations at the Fe-rich sites (locations (10), (11) and (13)) seemed higher than those of MC1700 at location (3). Phosphorus was not detected on MC1300. In general, the variations in concentrations of Zr, O and F between matrix and IMPs are less pronounced for MC1700 than MC1300, indicating different courses of coating formation.
Figures 9a and 9b show MC1700-coated CP-AA3003 after 24 h immersion in 3.5 wt% NaCl. The surface morphology did not change significantly during immersion, but the layer became notably thicker (Figs. 8a and 9a). More importantly, unlike the bare sample (Fig. 7b), no corrosion damage was observed (Figs. 9a, 9b). One of the notable differences before and after immersion in 3.5 wt% NaCl was the reduction of F concentration during immersion in NaCl for both conversion coatings MC1700 and MC1300 (Table VI). For instance, the concentration of F in the matrix of sample MC1700 is 2 times lower after immersion in NaCl than before immersion, i.e. after air drying (Tables V and VI). In the case of IMP Al(Me,Fe)Si, the reduction is even more pronounced, with F concentration decreasing by 9 times, ranging from 1.8 (location (3), Table V) to 0.2 at% (location (1), Table VI).
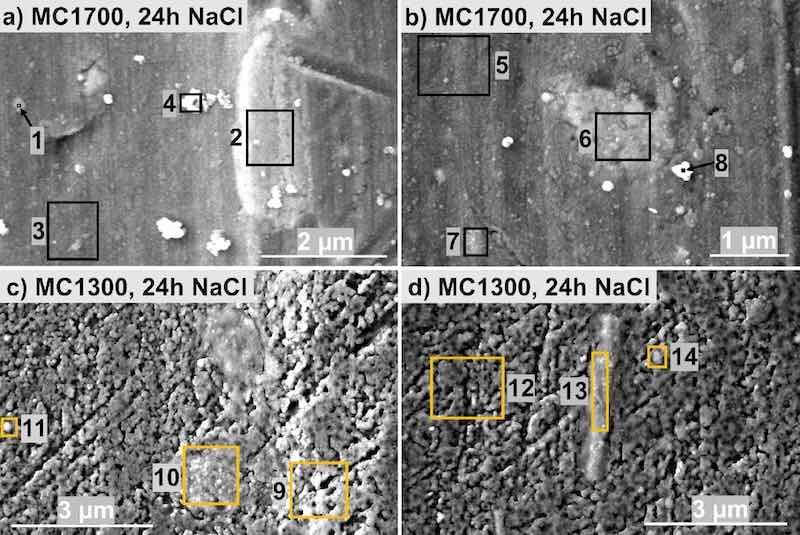
Figure 9. SEM SE images of (a, b) MC1700 and (c, d) MC1300 coated CP-AA3003. The conversion times were 10 min for MC1700 and 7 min for MC1300. After deposition, samples were immersed for 24 h in 3.5 wt% NaCl. BSE images are given in Figs. S7 and S8. EDS analysis was made at the enumerated sites, and the results are given in Table VI.
Table VI. EDS analysis of MC1700 and MC1300 coated CP-AA3003 after 24 h of immersion in 3.5 wt% NaCl (Fig. 9). Notation “m” in the first column denotes the matrix. For quantification, please refer to the footnote.a
| Location | Sample | O | Al | Mn | Fe | Si | Zr | P | F | Cu | Cr | Mn/Fe |
| 1 | MC1700_NaCl | 17 | 64 | 6.3 | 3.9 | 3.6 | 3.3 | 1.7 | <1 | — | — | 1.6 |
| 2 | 18 | 63 | 7.5 | 6.2 | — | 3.2 | 1.6 | 1 | — | — | 1.2 | |
| 3 m | 15 | 81 | — | — | — | 2.4 | 1.2 | <1 | — | — | — | |
| 4 m | 20 | 74 | — | — | 1.3 | 2.1 | 2.3 | <1 | — | — | — | |
| 5 m | 13 | 83 | — | — | — | 1.8 | 1.4 | <1 | — | — | — | |
| 6 | 13 | 69 | 8.3 | 6.7 | — | 2.5 | — | <1 | — | — | 1.2 | |
| 7 | 14 | 73 | 4.7 | — | 3.3 | 2.7 | 1.6 | <1 | 0.3 | — | — | |
| 8 m | 33 | 56 | — | — | 4.1 | 3.6 | 3.0 | <1 | — | — | — | |
| 9 m | MC1300_NaCl | 6 | 93 | — | — | — | 0.9 | — | — | — | — | — |
| 10 | 19 | 62 | 6.0 | 7.5 | — | 4.3 | — | 1 | 0.4 | — | 0.8 | |
| 11 | 14 | 73 | 5.3 | 2.5 | 2.7 | 2.6 | — | — | — | — | 2.1 | |
| 12 m | 7 | 93 | — | — | — | 0.8 | — | — | — | — | — | |
| 13 | 36 | 41 | 3.9 | 5.2 | — | 9.0 | — | 1 | — | 3.1 | 0.75 | |
| 14 | 17 | 74 | 1.4 | 0.9 | 1.5 | 3.8 | — | <1 | — | — | 1.5 |
Similar trends are evident for the conversion coating MC1300, where, in the case of IMP Al(Mn,Fe), the F concentration decreased by 4 times, from about 5–6 at% (locations (10) and (11), Table V) to approximately 1 at% (locations (10) and (13), Table VI). A decrease in the F/Zr ratio observed during NaCl immersion indicates depletion of fluoride or oxyfluoride species. A similar reduction in F after immersion in NaCl was also observed in the study by Šekularac and Milošev, where ZrCC were tested on the aluminium alloy AA3005.23 The concentration of Zr at the IMP remained high (locations (10), (11), (13) and (14)).
During EDS analysis of the CP-AA3003 sample coated with MC1700, it was challenging to determine the accurate elemental composition. In the EDS spectrum, the F, Mn, and Fe peaks were closely spaced or overlapped due to their low energies (0.677 keV for F, 0.636 keV for Mn, and 0.703 keV for Fe). The accuracy of the identified elements was verified by comparing the experimental spectrum with theoretical spectra generated for different elemental combinations. Based on the knowledge of the sample’s preparation and expected composition, a list of potential elemental combinations was established. This approach involved simulating the EDS spectrum for each potential combination of elements and comparing it to the experimental spectrum obtained from the sample. By evaluating the degree of overlap and similarity between the theoretical and experimental peaks, we systematically assessed the validity of each elemental combination and identified the most accurate representation of the sample’s composition. When all three elements, F, Mn, and Fe, were assumed to be present, the theoretical peaks aligned, although slightly shifted upwards (Fig. S9). For easier identification of these elements, performing the analysis at a higher energy would be preferable. However, the limitations of EDS for low atomic mass elements like F, particularly in quantitative analysis, would impede its accurate detection at higher energies. XPS was employed to complement the EDS analysis, as described below.
Figures 9c and 9d show MC1300-coated CP-AA3003 after 24 h immersion in 3.5 wt% NaCl. Similar to MC1700, MC1300 formed a thicker layer covering the CP-AA3003 evenly. Locations (9) and (12) correspond to a matrix with approximately the same proportions of Al, O, and Zr. IMP Al(Fe, Mn) was identified at location (10) (Fig. 9c, Table VI) with an Mn/Fe ratio of 0.8. The Zr content at this spot was about 4 at%, accompanied by the presence of F and Cu. A spherical white particle at location (11) (Fig. 9c) corresponds to IMP Al(Fe, Mn)Si with an Mn/Fe ratio of 2.1 and an Mn/Si ratio of 2. Zr was observed at this location at a proportion of 2.6 at%. At location (13) (Fig. 9d), where IMP Al(Fe, Mn) with an Mn/Fe ratio of 0.75, the highest concentration of Zr was observed, specifically 9 at% (Table VI). Before immersion (Table V), the content of Cr in the surface layer spanned between 0.3 and 4.2 at% and that of Zr between 0.6 and 10.5 at%. After immersion in NaCl, Cr was detected only at location (13), where the concentration of Zr was the highest (Table VI). In contrast, Zr concentration at the surface was still high and ranged between 0.8 and 9 at%. The behaviour of Zr and Cr in the coating can be explained by different solubility of Zr- and Cr- hydroxides, where the former exhibits smaller solubility in the near-neutral pH range.49
The disappearance of Cr following NaCl exposure can also be attributed to the disintegration of Cr(III) hydroxide from the mixed Zr-Cr oxide film due to the action of aggressive ions, such as chloride.58 Additionally, the conversion coating may exhibit non-uniform distribution across the AA3003 substrate, potentially resulting in variations in Cr content. However, because Cr is present only in trace amounts, its detection through EDS analysis is more challenging. At low analysis energies (conducted at 5 kV), the determination of Cr and Mn elements is hindered as their characteristic energy, 0.573 keV for Cr and 0.636 keV for Mn, overlap (Fig. S10). Therefore, Cr was determined by leveraging prior knowledge of expected elemental compositions and exploring various comparative scenarios. For instance, for location (13) in Fig. 9d, where IMP Al(Mn,Fe) is present, we anticipated the presence of Mn and considered different combinations with the presence of Cr (Fig. S10). When assuming both Mn and Cr were present, we obtained values indicative of Cr presence. Conversely, chromium was not detected when considering the presence of only Cr or Mn.
SEM-EDS analysis of coating cross-section
Cross-sections were prepared by FIB. SEM images of the cross-sections and corresponding EDS mapping of both conversion coatings MC1700 and MC1300 deposited on the CP-AA3003 sample were acquired after 24 h of immersion in 3.5 wt% NaCl.
First, MC1700 is considered. Two spots were analysed. The first spot, presented in Fig. S11, depicts SEM images of the top surface and cross-section and EDS mapping of the area around and above IMP containing Fe and Mn. The ZrCC, visible on top of the matrix and IMP, reached a thickness between 40 and 50 nm. The analysis at the second spot is presented in Fig. 10. Here, the ZrCC is thicker above the IMP, forming a dome and thinner above the matrix (as seen in Fig. 11). This IMP contains Cu, in contrast to the presented in Fig. S11, which may be the reason for increased cathodic activity resulting in increased pH and stimulated deposition of Zr-oxide. The top view of the surface shows the coated matrix with the nodular feature in the middle, presumably above the IMP, where the coating is thicker (Fig. 10a). A yellow square denotes this area of interest. The coating was removed by FIB to reveal the cross-section of the coating and the underlying substrate (Fig. 10b). On the left-hand side, the Al(Fe,Mn)Cu IMP is located above which a dome with ZrCC is located. Away from this nodular dome, the ZrCC also covers the matrix but thinner, as confirmed by the EDS mapping of this area for O, Zr, Al, Mn and Fe (Fig. 10); note that mapping for Cu is not presented due to low Cu concentration (Table VII).
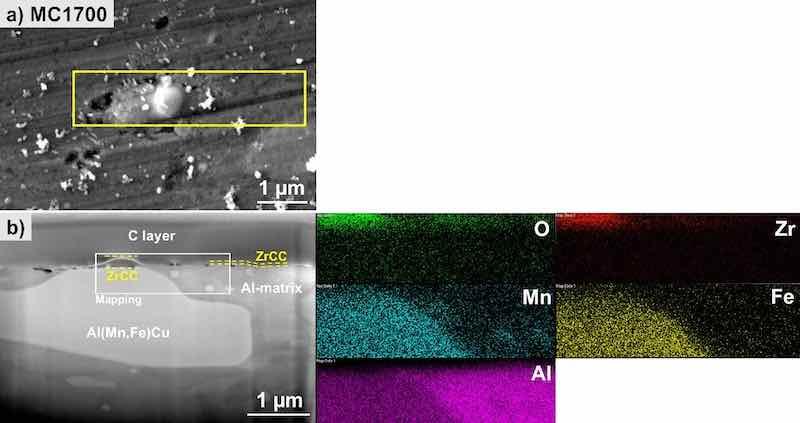
Figure 10. SEM image (SE mode) of the (a) top surface and (b) cross-section and EDS elemental mapping of the selected site on the MC1700-CP-AA3003-coated sample after immersion 24 h in 3.5 wt% NaCl. SEM and EDS analyses were made at 5 kV. The area denoted by the yellow square in the SEM image (a) is the position where the cross-section was done. The area on SEM image (b) where the mapping was recorded is denoted by the white rectangle.
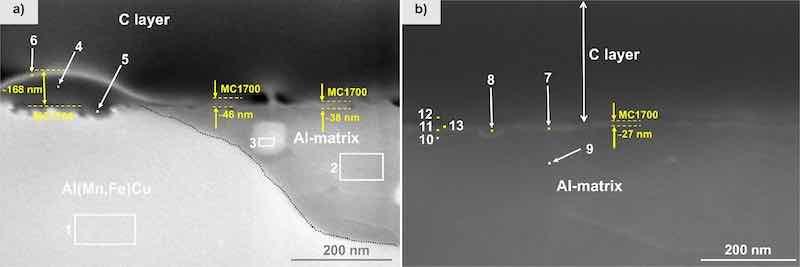
Figure 11. FIB-SEM (SE mode) of the cross-section for MC1700coated CP-AA3003 with conversion time 10 min. After deposition, samples were post-treated for 24 h in 3.5 wt% NaCl. Images were recorded at (a) intermetallic particle and adjacent matrix, and (b) at the matrix away from the IMP. EDS analysis was made at the enumerated sites; the results are given in Table VII.
Table VII. EDS analysis given in atomic ratios of elements at the cross-section of MC1700 conversion coating on CP-AA3003 after 24 h immersion in 3.5 wt% NaCl (Fig. 11). For quantification, please refer to the footnote.a
| Location | O | Al | Mn | Fe | Zr | Cu | F |
| 1 | 3 | 84 | 5.2 | 7.8 | — | 0.5 | — |
| 2 | 2 | 97 | — | — | — | — | — |
| 3 | 3 | 97 | — | — | — | — | — |
| 4 | 17 | 67 | 6.0 | 3.6 | 5.8 | — | — |
| 5 | 3 | 84 | 7.5 | 5.7 | — | — | — |
| 6 | 22 | 52 | 4.6 | 3.3 | 16.7 | — | 1 |
| 7 | 7 | 92 | — | — | 0.8 | — | — |
| 8 | 6 | 93 | — | — | 1.0 | — | — |
| 9 | 3 | 97 | — | — | — | — | — |
| 10 | 6 | 94 | — | — | — | — | — |
| 11 | 5 | 95 | — | — | 0.6 | — | — |
| 12 | 14 | 83 | — | — | 2.8 | — | — |
| 13 | 11 | 86 | — | — | 2.6 | — | — |
Subsequently, a detailed EDS analysis of the cross-section was performed to verify the deposition of the conversion coating on the sample (Fig. 11a and Table VII). The cross-sectional line intersects both a copper-containing IMP (location (1)) and the surrounding matrix (locations (2) and (3)). The observed high coating coverage, indicated by the accumulated grey nodular features (locations (4)-(6)), predominantly occurs on the Al(Fe,Mn)Cu IMP (location (1)). In this area, the conversion coating MC1700 achieves a thickness of approximately 170 nm (Fig. 11a). The intensified coating surrounding intermetallic phases is attributed to the pH gradient formation resulting from dissolved oxygen reduction at these locations in contrast to the adjacent aluminium matrix.44,59 Additionally, the characteristic elements of the coating, namely Zr and O, were found to be co-localised in this region. Fluorine, an element in the conversion coating, was detected solely at the outermost light-coloured boundary at location (6) in Fig. 11a.
As observed in Fig. 11a, a thicker layer, between 38 and 46 nm thick, was present near the Cu-rich IMP. Above the matrix region further away from the IMP (Fig. 11b), the coating thickness ranged around 27 nm. This variation in coating thickness can be attributed to the influence of the IMP’s composition. Al(Mn,Fe)Cu particles, exhibiting higher cathodic activity than the surrounding matrix, facilitated faster nucleation and growth of the conversion coating. This observation aligns with previous studies, indicating that cathodic sites promote coating growth.25,60 The rate of reduction of dissolved oxygen is anticipated to be faster within the IMP enriched with copper; consequently, this is expected to lead to a more localized alkaline pH environment around these particles, which likely contributes to the observed thicker coating in these areas.
The FIB-SEM-EDS analysis for the MC1300 conversion coating is presented in Figs. 12 and 13. The top view of the surface shows the coated matrix with the IMP coated more homogeneously than the matrix but not forming a distinctive dome-like feature as for MC1700 (Fig. 12a). A yellow square denotes this area of interest where the coating was removed by FIB to reveal the cross-section (Fig. 12b), which exposed the Al(Fe,Mn)Cu IMP coated with a thin ZrCC, as confirmed by the EDS mapping of this area for O, Zr, Al, Mn and Fe (Fig. 12).
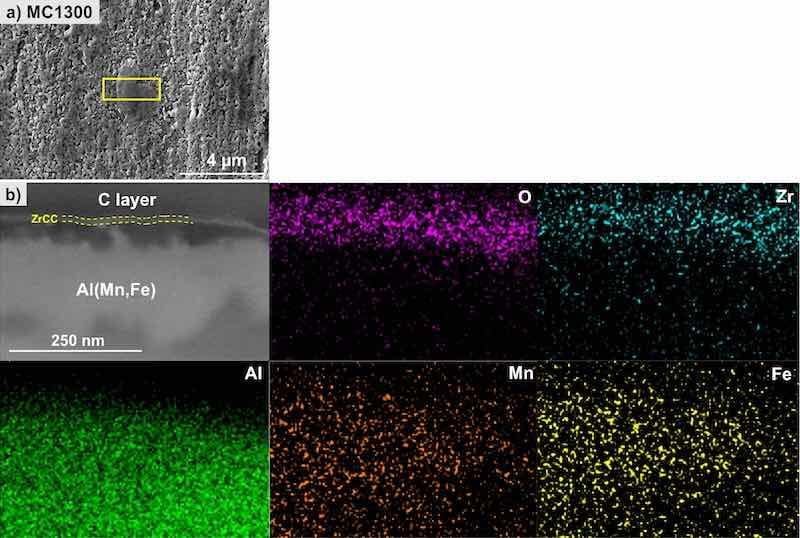
Figure 12. SEM image (SE mode) of the (a) top surface and (b) cross-section and EDS elemental mapping of the selected site on the MC1300-CP-AA3003-coated sample after immersion for 24 h in 3.5 wt% NaCl. SEM and EDS analyses were made at 5 kV. The area denoted by the yellow square in the SEM image (a) is the position where the cross-section was done.
A more detailed SEM-EDS analysis of the cross-section is presented in Fig. 13. Zr was detected in locations (5), (6), (9)–(14) (Table VIII). On Cu-containing IMP (location (1)), the coating thickness ranged between 10 and 50 nm (Figs. 13a and 13b), while no conversion coating was detected on the matrix (locations, (15)–(17), Figs. 13c, Table VIII). This suggests that either the coating does not fully cover the matrix surface or is too thin to be detected by EDS analysis. This observation indicates the reasons for the poorer performance of the conversion coating MC1300 in PD measurements compared to MC1700.
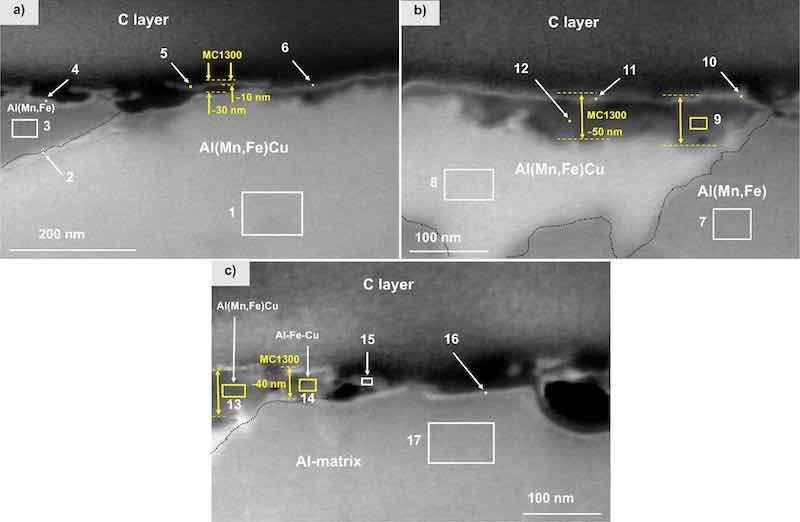
Figure 13. FIB-SEM (SE mode) of the cross-section for MC1300coated CP-AA3003 with conversion time 7 min. After deposition, samples were post-treated for 24 h in 3.5 wt% NaCl. Images were recorded at (a,b) intermetallic particles and (c) at the matrix away from the IMP. EDS analysis was made at the enumerated sites; the results are given in Table VIII.
Table VIII. EDS analysis given in atomic ratios of elements at the cross-section of MC1300 conversion coating on CP-AA3003 after 24 h immersion in 3.5 wt% NaCl (Fig. 13). For quantification, please refer to the footnote.a
| Location | O | Al | Mn | Fe | Zr | Cu |
| 1 | 5 | 83 | 5.9 | 6.0 | — | 0.5 |
| 2 | 6 | 83 | 4.9 | 5.6 | — | — |
| 3 | 7 | 90 | 1.8 | 1.8 | — | — |
| 4 | 11 | 85 | 1.8 | 2.3 | — | — |
| 5 | 14 | 73 | 4.3 | 6.4 | 1.8 | 0.7 |
| 6 | 18 | 66 | 4.0 | 7.1 | 3.5 | 0.8 |
| 7 | 4 | 91 | 3.5 | 1.7 | — | — |
| 8 | 5 | 84 | 6.6 | 4.1 | — | 0.1 |
| 9 | 16 | 75 | 3.4 | 2.4 | 3.0 | 0.2 |
| 10 | 19 | 74 | 1.9 | 1.3 | 3.5 | 0.3 |
| 11 | 32 | 51 | 3.7 | 2.6 | 10.1 | 0.6 |
| 12 | 16 | 71 | 5.3 | 3.5 | 3.4 | 0.4 |
| 13 | 25 | 64 | 2.9 | 1.8 | 6.0 | 0.3 |
| 14 | 15 | 83 | — | 0.3 | 2.2 | 0.1 |
| 15 | 8 | 92 | — | — | — | — |
| 16 | 5 | 94 | — | — | — | — |
| 17 | 5 | 95 | — | — | — | — |
XPS characterisation of coating
XPS spectra were recorded on the CP-AA3003 sample without the conversion coating and for MC 1700 and MC1300-coated AA3003 samples after drying in the air and immersed in NaCl for 24 h (Fig. 14). The composition of the surface deduced from survey spectra is given in Table IX. The composition of sample CP-AA3003_NaCl includes Al and O, denoting the Al oxide’s formation. A small amount of N can be attributed to multiple sources, e.g., residual nitrogen-containing compounds from the nitric acid.
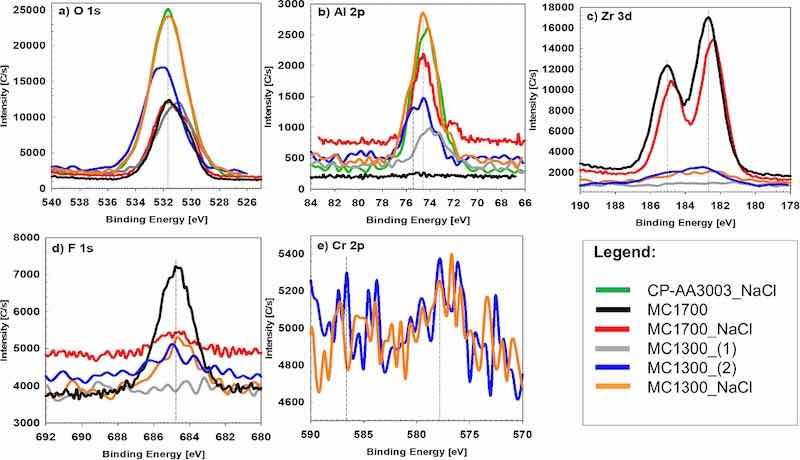
Figure 14. High-resolution XPS spectra of (a) O 1s, (b) Al 2p, (c) Zr 3d, (d) F 1s, and (e) Cr 2p recorded for chemically pre-treated A3003 samples (denoted as CP-AA3003_NaCl) after 24 h immersion in 3.5 wt% NaCl and samples coated with MC1700 and MC1300 coatings after 24 h of air drying (denoted as MC1700 and MC1300) and 24 h immersion in 3.5 wt% NaCl (denoted as MC1700_NaCl and MC1300_NaCl). For MC1300, two spots (1 and 2) were analysed, with less and more Zr.
Table IX. The concentrations of main elements obtained by XPS analysis of chemically pre-treated AA3003 samples after 24 h of immersion in 3.5 wt% NaCl (denoted as CP-AA3003_NaCl) and samples coated with MC1700 and MC1300 after 24 h air drying (denoted as MC1700 and MC1300) and 24 h of immersion in 3.5 wt% NaCl (denoted as MC1700_NaCl and MC1300_NaCl). For MC1300, two spots were analysed, with less and more Zr.
| Sample | O | Al | Si | Zr | Cr | F | N | Cl |
| CP-AA3003_NaCl | 78.3 | 21.1 | — | — | — | — | 0.6 | — |
| MC1700 | 67.8 | 12.1 | — | 14.5 | — | 5.6 | — | — |
| MC1700_NaCl | 73.7 | 10.9 | — | 12.8 | — | 0.8 | 1.8 | — |
| MC1300_(1) | 71.1 | 12.5 | 1.3 | 1.3 | — | 0.3 | 13.5 | — |
| MC1300_(2) | 73.2 | 11.2 | 1.2 | 3.1 | 2.2 | 3.6 | 5.6 | — |
| MC1300_NaCl | 74.3 | 21.3 | — | 1.4 | 1.3 | 1.6 | — | 0.9 |
The air-dried MC1700-coated CP-AA3003 sample contained ∼14 at% Zr, confirming the formation of ZrCC (Table IX). The presence of coating results in the reduced concentration of detected Al. Additionally, F was detected at ∼5 at%.
The Zr concentration for the MC1300 air-dried sample was generally lower than for the MC1700 sample. The analyses were conducted at two sites, one at the centre of the sample (site 1, denoted as MC1300_(1) in Table IX), where the Zr content was relatively low, and the other with a higher Zr content (site 2, denoted as MC1300_(2)). A higher content of Zr at the site (2) was accompanied by the detection of Cr. The MC1300_(2) also contained N, possibly related to nitrates from the conversion bath or ammonium-based compounds for pH adjustment (Fig. S12). The detected Si content originates from the IMP (Fig. S12). F is related to the ZrCC, as its content follows that of Zr (and Cr).
After 24 h of immersion in NaCl, the concentration of Zr at the surface of MC1700 was similar to before the immersion, but the F content was reduced (Table IX). The contents of Zr and Cr on the MC1300 sample were similar and much lower than those of Zr on MC1700.
The high-resolution XPS spectra in Fig. 14 show the main elements detected in the survey XPS spectra. Figure 14a presents a high-resolution spectrum of the O 1s peak, which is centred at 531.5 eV and corresponds to the hydrated Al oxide for CP-AA3003_NaCl and a mixture of Al and Zr-oxides in the case of coated samples.
Figure 14b represents the Al 2p peak located at 74.2 eV, related to the position of hydrated Al(III) oxide.70 For CP-AA3033, O 1s and Al 2p are the most intense signals. After the formation of conversion coatings and post-treatment in NaCl, the intensity of the Al peak diminished due to the coverage of AA3003 with conversion coatings MC1700 and MC1300. Similar behaviour was also observed in our previous study on AA3005.23 However, the intensity of Al 2p for the MC1300_NaCl was higher than that of the other conversion coatings, which may suggest that the ZrCC coating on this sample was thinner or more inhomogeneous than the other samples.
The presence of Zr is an essential indicator of the successful deposition of the conversion coating onto the sample’s surface. High-resolution Zr 3d spectra recorded after the conversion coating process are shown in Fig. 14c. The intensity of Zr 3d peaks for MC1700 and MC1700_NaCl were much higher than those for MC1300 and MC1300_NaCl. The Zr 3d5/2 and 3d3/2 peaks were located at binding energies of ∼183 eV and ∼185 eV, respectively, referring to hydrated ZrO2.70
The F 1s peak for air-dried MC1700 was centred at ∼685 eV, suggesting the presence of traces of Na2ZrF6 or ZrF4 (Fig. 14d).56,70 For this sample, the intensity of F 1s peaked at the highest due to the highest Zr content. It is reduced after immersion in NaCl. For MC1300, the intensity of the F 1s peak was much smaller, following the smaller contents of Zr in the coating.
The high-resolution Cr 2p XPS spectra are of very low intensity, so the interpretation is limited (Fig. 14e). However, it can be recognised that the spectrum displays two Cr 2p3/2 and 2p1/2 photoelectron peaks centred at 577.2 and 586.6 eV. The reference lines referring to the Cr(III) hydroxide and Cr(III) oxide are at 577.8 eV and 576.2–576.7 eV, indicating that Cr is present as trivalent Cr.70
Figure 15 shows XPS depth profiles of the CP-AA3003 sample coated with MC1700 for 10 min after 24 h of drying in the air and immersion in NaCl. The depth profiles were generally similar, with some discrepancies. The surface was comprised of O, Zr, Al, and some fluoride. As the sputtering proceeded, the concentration of O and Zr decreased, and that of Al increased. In the MC1700_air sample, the Zr concentration at the surface was around 14 at% and then reduced progressively within the coating depth.
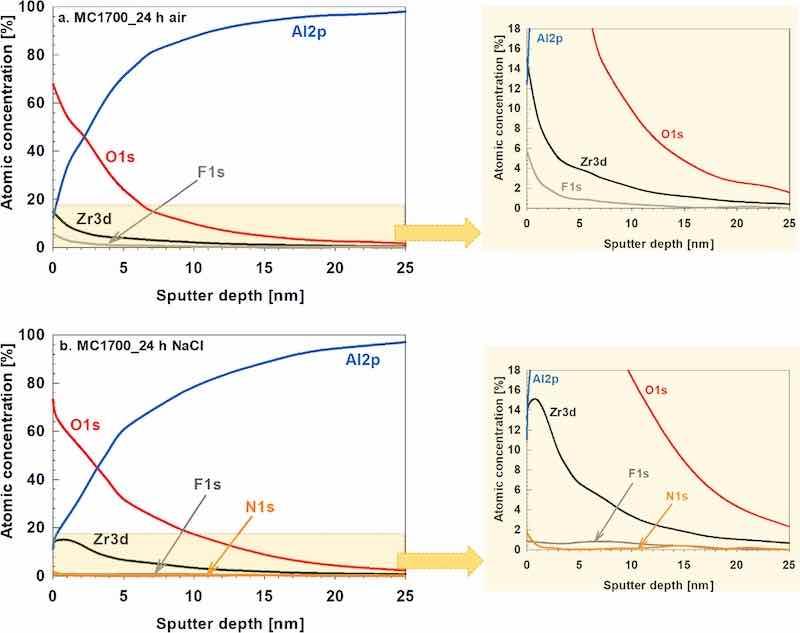
Figure 15. XPS depth profiles recorded on the chemically pre-treated AA3003 sample coated using conversion coating MC1700 for 10 min. After deposition, samples were post-treated by (a) drying for 24 h in air and (b) immersion for 24 h in 3.5 wt% NaCl.
In contrast, after immersion in NaCl, the Zr concentration peaked at 15 at% approximately 1 nm below the surface, as a build-up of Zr-oxide occurred in the sub-surface region. For MC1700_air, F content decreased from 5.6 at% at the surface to coating depth; for MC1700_NaCl, however, it is detected in less than 1 at% at the surface, indicating that fluoride is released from the coating during immersion in NaCl. This means that the F content was reduced 7 times during immersion. The coating also contained N (likely originating from the conversion coating). After immersion in NaCl, the Al peak was still detected at the surface, i.e. it was not dissolved during immersion. The shape of the O curve suggests an enrichment of oxide in the sub-surface region, which aligns with our previous results that during immersion in NaCl, ZrCC seals with Al-oxide,23,24 which contributes to the increased protectiveness of the coating. The thickness of the coatings was similar before and after immersion in NaCl.
High-resolution spectra provided in the supplement (Figs. S13 and S14) support the depth profile interpretation. For MC1700_air, the surface was composed mainly of ZrO2, Al2O3 and metal fluorides, with a gradual transition toward metallic aluminium observed with increasing depth. After NaCl exposure, the coating still contained ZrO2 and Al2O3, while fluoride was almost completely leached from the layer. A subsurface enrichment of Zr and O is confirmed, in agreement with the previously described sealing effect by Al-oxide.69 Nitrogen-containing species (N 1s) appeared after immersion.
The XPS depth profile for the CP-AA3003 coated with MC1300 and subject to 24 h air drying shows that the surface comprises O, Zr and Al (Fig. 16a). The XPS profile was recorded at the spot where the Zr concentration was larger (spot 2, Table IX). The surface concentrations of Zr and Cr were relatively low; however, both elements showed subsurface enrichment, with Zr reaching a maximum of ∼12 at% and Cr peaking at ∼3 at% around 7 nm below the surface, suggesting their co-deposition in the main barrier layer. The coating also contained F and some N.
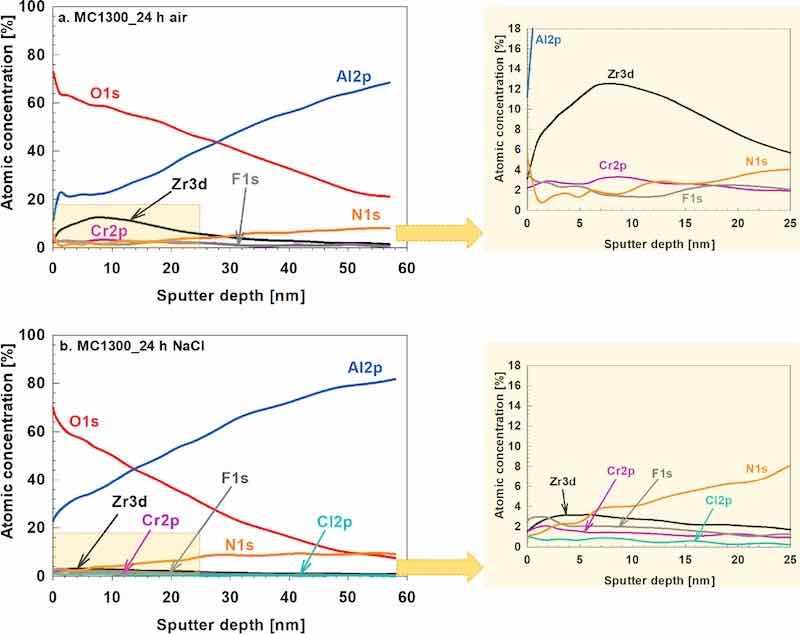
Figure 16. XPS depth profiles recorded on the chemically pre-treated AA3003 sample coated using conversion coating MC1300 for 7 min. After deposition, samples were post-treated by (a) drying for 24 h in air and (b) immersion for 24 h in 3.5 wt% NaCl. The analysis was made at the spot (2) (Table IX).
The thickness of the coating somewhat decreased after 24 h immersion in NaCl (judging from the O/Al intersection). The sub-surface build-up of Zr-oxide diminished, and the coating reached a maximum Zr content of around 3 at% just below the surface (Fig. 16b). The concentration of Cr also decreased during immersion in NaCl. In contrast to MC1700, the F content did not diminish during immersion in NaCl but was still present within the coating depth. N-containing species in the MC1300 coating may be more strongly bonded or incorporated into the structure. Moreover, the Cl signal was present in the depth profile for MC1300 after 24 h immersion in 3.5 wt% NaCl (Fig. 16b), which was not the case with the MC1700 (Fig. 15b).
Further interpretation of the high-resolution spectra for MC1300 (Figs. S15 and S16) revealed that Zr was present at the surface as ZrO2, while Cr was detected in the form of Cr(III) oxide or hydroxide. The oxygen signal corresponds to a combination of metal oxides and hydroxides. F is present as metal fluorides, likely Zr–F and/or Cr–F, and remains detectable throughout the coating even after NaCl exposure. Al is initially present in the oxidised form and gradually transitions to metallic Al with increasing depth, as observed for both MC1300 and MC1700. After immersion in NaCl, N-containing species persisted. Chlorides were incorporated into the coating MC1300, indicating interaction with the NaCl solution.
This study showed that when prepared at the same concentration of 5 wt% and defined conversion times, the coatings MC1700 and MC1300 differ in composition, thickness and mode of protection (i.e. electrochemical response).
The exact mechanism of MC1300 conversion coating formation on AA3003 remains uncertain based solely on the findings of this study. However, certain hypotheses can be proposed by referencing existing literature on similar systems.
Frankel et al.58 reported that Cr(III) in TCP coatings is not uniformly distributed but is predominantly concentrated around pits, as confirmed by Raman spectroscopy and XPS. This uneven distribution is likely a consequence of local pH variations during coating formation, promoting the co-precipitation of Cr(III) hydroxides (Cr(OH)3, CrOOH, Cr2O3) alongside hydrated ZrO2. Chloride ions may lead to the partial dissolution of Cr(III) hydroxide from the Zr-Cr oxide film, potentially affecting coating stability. While TCP coatings provide active corrosion protection, their protective mechanism differs from chromate coatings, as Cr(III) is significantly less soluble than Cr(VI) and does not exhibit comparable self-healing properties.58 However, some Cr(III) species may dissolve non-faradaically and redeposit onto exposed aluminium surfaces, contributing to localized protection. ICP-OES analysis confirmed the presence of Cr species in the electrolyte but not Zr, indicating selective dissolution and redeposition of Cr(III) within TCP coatings.58 It was reported that Cr was dissolved during prolonged immersion of the TCP coating in dilute Harrison’s solution,58 whereas the Zr dissolution was minimal. Our previous study56 showed that Zr-Cr conversion coating acts as an active corrosion protection interlayer and contributes to the overall protectiveness of the multilayer system with sol-gel coatings.
During the deposition of MC1300 in an acidic conversion bath (pH ≈4.1), the dissolution of less noble metals present in AA3003, such as Mn, Fe, Cu, and Si, occurs. This process is further facilitated by fluoride ions, which attack the native oxide layer and enhance the penetration of ZrF₆2⁻ species into the substrate. In the absence of fluoride-containing species, Zr hydroxide precipitation occurs through hydrolysis.37 Fluoride plays a dual role in the conversion process: it reduces the thickness of the naturally formed oxide layer and shifts the pH range for Zr hydroxide precipitation between 3 and 6, depending on the Zr species concentration. This pH adjustment is particularly beneficial for aluminium substrates prone to corrosion in acidic environments.37,51,71 The cathodic oxygen reduction reaction promotes the co-deposition of Zr and Cr (hydr)oxides as the pH approaches 4,37 leading to the formation of a thin protective Zr-CrCC layer with a thickness ranging between 20 and 120 nm.37,40,61
Studies on similar systems have demonstrated that TCP coatings exhibit a multiphase structure. Li et al. reported that Alodine T5900 (Henkel) consists of a biphasic structure composed of hydrated zirconia (ZrO2·2H2O) combined with Cr(III) hydroxides, such as Cr(OH)3, CrOOH, and Cr2O3, which are deposited above a fluoroaluminate interlayer on AA2024.55,62 The Cr content in these coatings was not uniformly distributed and was predominantly concentrated around pits, contributing to both anodic and cathodic protection by physically blocking corrosion-prone Al-rich sites and Cu-containing intermetallic particles.55 Similarly, in our study, we observed non-uniform distribution of the coating on AA3003, with the thinnest regions forming over the matrix, while the thickness increased over intermetallic particles such as Al(Fe, Mn)Si and Al(Fe, Mn)Cu.
Guo and Frenkel61 determined that the Cr content in the Alodine T5900 (Henkel) coating was only one-fourth of the Zr content, with the overall coating thickness ranging between 40 and 120 nm, which was significantly thicker than conversion coatings without Cr. In our XPS depth profile analysis, we observed that after NaCl exposure, the Cr concentration was approximately 60% of the Zr concentration, whereas, after 24 h of air exposure, the Cr content was nearly four times lower.
The MC1300 coating showed partial degradation of Zr oxide, while fluoride remained within the layer and chloride ions infiltrated the deeper regions. Depth profile analysis identified a Cr-enriched layer beneath the surface, indicating that Cr(III) may contribute to the structural stability of the coating.40
Qi et al.68 examined SurTec ST650 and confirmed the presence of various Cr(III)-containing species, including Cr(OH)3, Cr2(SO4)3, CrF3, CrO3, and CrO42⁻, which aligns also with our previous studies.40,56 Additionally, they found that the conversion coatings formed on AA2024 alloy using SurTec ST650 exhibited a two-layer structure, consisting of an inner Al-rich layer and an outer Cr- and Zr-rich layer, with a Cr:Zr atomic ratio ranging from approximately 0.73 to 0.93.63
This study has still not entirely clarified the role of Cr, and further study is required to address the dissolution of Cr from MC1300 and its role in active protection.
Conclusions
The Zr- and Zr/Cr(III)-based conversion coatings were deposited from solutions with a weight concentration of 5% on chemically pre-treated 3003 aluminium alloy, aiming to study their composition, structure and thickness as well as the effect of post-treatment: 24 h of air-drying and 24 h of immersion in 3.5 wt% NaCl. The main conclusions are summarised as follows.
1. EDS analysis detected no ZrCC formation at the shortest conversion times (120 s for MC1700 and 80 s for MC1300) for both coatings. Electrochemical measurements, however, showed a change in corrosion behaviour compared to the non-coated substrate, suggesting that a thin conversion coating was formed. This discrepancy can be attributed to the small thickness of the coating, which is below the detection limit of EDS analysis.
2. After SEM/EDS analysis and evaluation of electrochemical parameters, the optimal conversion times were identified as 10 min for MC1700 and 7 min for MC1300.
3. SEM/EDS analysis of the MC1700 and MC1300 coatings deposited at 10 and 7 min show that Zr concentration is larger at Al(Fe,Mn)Si and Al(Fe,Mn)Cu intermetallic particles than at the matrix. The coating morphology differs: MC1700 comprises a fine, 20–50 nm nodular structure and MC1300 exhibits a coarser grain size of around 150 nm. At the same weight concentration, the MC1700 extends over the matrix and IMPs, and MC1300 primarily over IMPs.
4. SEM/EDS analysis of the cross-section shows that the MC1700 conversion coating prepared with a conversion time of 10 min has a thickness of around 30 nm above the matrix and around 170 nm above IMP after immersion in 3.5 wt% NaCl. The MC1300 coating prepared with a conversion time of 7 min is around 50 nm thick above the IMP, 10–30 nm in the vicinity of IMP, and none at the matrix.
5. XPS results were consistent with EDS. The notable result is that fluoride is released from the coating during immersion in NaCl. MC1700 contains Zr, and MC1300 both Zr and Cr. During immersion of MC1700 in NaCl, fluoride is released from the coating, and the Zr-oxide builds up in the sub-surface region.
6. After 24 h of air drying, the MC1700 coating offered enhanced cathodic rather than anodic inhibition, accompanied by reduced polarisation resistance and increased corrosion current density, but an extension of the passive range compared to the pre-treated samples. In the case of the MC1300-coated sample, the extended air drying period did not lead to a substantial enhancement in corrosion behaviour.
7. After 24 h in 3.5 wt% NaCl, the MC1700-coated sample revealed reduced corrosion current densities and nearly fourfold higher polarisation resistance compared to the non-coated sample, indicating a transition from cathodic to anodic inhibition. In contrast, the polarisation curve for the MC1300-coated sample shifted in a more negative direction, significantly increasing the passive range. These findings suggest that the Zr-based MC1700 coating provides superior inhibition efficiency compared to Zr-Cr-based MC1300, regardless of the post-conversion treatment, particularly after 24 h of immersion in NaCl.
8. The results show that relevant information on the protectiveness of coated samples can be obtained only after prolonged immersion in 3.5 wt% NaCl.
9. It is important to note that the interpretation of the obtained results is limited by the unknown precise composition of the commercial conversion coatings used in this study. While the functional performance of the coatings was evaluated, the absence of detailed compositional data prevents a definitive correlation between specific chemical components and observed behaviours.
Maja Mujdrica Kim is with TRIMO d.o.o., SI-8210 Trebnje, Slovenia, Jožef Stefan International Postgraduate School, SI-1000 Ljubljana, Slovenia. Barbara Kapun is with Jožef Stefan Institute, Department of Physical and Organic Chemistry, SI-1000 Ljubljana, Slovenia. Ingrid Milošev is with Jožef Stefan International Postgraduate School, SI-1000 Ljubljana, Slovenia, and the Jožef Stefan Institute, Department of Physical and Organic Chemistry, SI-1000 Ljubljana, Slovenia
Acknowledgments: The authors acknowledge Prof. Janez Kovač and Tatjana Filipič, MSc, for XPS measurements (Department of Surface Engineering of the Jožef Stefan Institute). The financial support from the Slovenian Agency for Research and Innovation is acknowledged (core programme No. P2–0393). The authors acknowledge using SEM/EDS equipment at the Center for Electron Microscopy and Microanalysis (CEMM) of the Jožef Stefan Institute and Nanocenter Center of Excellence for Nanoscience and Nanotechnology.
References
- 1. L. Xiaoyang et al., ACS Appl. Nano Mater., 2, 1920 (2019).
- 2. B. Tepe and B. Gunay, Prog. Org. Coat., 62, 134 (2008).
- 3. P. D. Deck and D. W. Reichgott, Met. Finish., 90, 29 (1992).
- 4. P. D. Deck, M. Moon, and R. J. Sujdak, Prog. Org. Coat., 34, 39 (1998).
- 5. T. Schram, G. Goeminne, H. Terryn, W. Vanhoolst, and P. Van Espen, Transactions of the IMF, 73, 91 (1995).
- 6. L. Fedrizzi, F. De orian, and P. L. Bonora, Electrochim. Acta, 42, 969 (1997).
- 7. P. Laha, T. Schram, and H. Terryn, Surf. Interface Anal., 34, 677 (2002).
- 8. J. H. Nordlien, J. C. Walmsley, H. Østerberg, and K. Nisancioglu, Surf. Coat. Technol., 153, 72 (2002).
- 9. O. Lunder, C. Simensen, Y. Yu, and K. Nisancioglu, Surf. Coat. Technol., 184, 278 (2004).
- 10. F. Andreatta, A. Turco, I. De Graeve, H. Terryn, J. H. W. De Wit, and L. Fedrizzi, Surf. Coat. Technol., 201, 7668 (2007).
- 11. 12. S. S. Golru, M. M. Attar, and B. Ramezanzadeh, J. Ind. Eng. Chem., 24, 233 (2015). P. Santa Coloma, U. Izagirre, Y. Belaustegi, J. B. Jorcin, F. J. Cano, and N. Lapeña, Appl. Surf. Sci., 345, 24 (2015).
- 13. F. O. George, P. Skeldon, and G. E. Thompson, Corros. Sci., 65, 231 (2012).
- 14. G. Yoganandan, K. Pradeep Premkumar, and J. N. Balaraju, Surf. Coat. Technol., 270, 249 (2015).
- 15. X. Zhong, X. Wu, Y. Jia, and Y. Liu, Appl. Surf. Sci., 280, 489 (2013).
- 16. A. Sarfraz, R. Posner, M. M. Lange, K. Lill, and A. Erbe, J. Electrochem. Soc., 161, C509 (2014).
- 17. N. W. Khun, G. S. Frankel, and J. Zimmerman, Corrosion, 69, 259 (2013).
- 18. L. Li, B. W. Whitman, and G. M. Swain, J. Electrochem. Soc., 162, C279 (2015).
- 19. L. Li, B. W. Whitman, C. A. Munson, R. Estrada, C. A. Matzdorf, and G. M. Swain, J. Electrochem. Soc., 163, C718 (2016).
- 20. D. Peng, J. Wu, X. Yan, X. Du, Y. Yan, and X. Li, J. Coat. Technol. Res., 13, 837 (2016).
- 21. L. I. Fockaert, S. Pletincx, D. Ganzinga-Jurg, B. Boelen, T. Hauffman, H. Terryn, and J. M. C. Mol, Appl. Surf. Sci., 508, 144771 (2020).
- 22. L. I. Fockaert, S. Pletincx, B. Boelen, T. Hauffman, H. Terryn, and J. M. C. Mol, Appl. Surf. Sci., 508, 145199 (2020).
- 23. G. Šekularac and I. Milošev, J. Electrochem. Soc., 167, 021509 (2020). Journal of The Electrochemical Society, 2025 172 061501
- 24. G. Šekularac, J. Kovač, and I. Milošev, Corros. Sci., 169, 108615 (2020).
- 25. S. Adhikari, K. A. Unocic, Y. Zhai, G. S. Frankel, J. Zimmerman, and W. Fristad, Electrochim. Acta, 56, 1912 (2011).
- 26. W. Zhan, X. Qian, B. Gui, L. Liu, X. Liu, Z. Li, and L. Hu, Mater. Corros., 71, 419 (2020).
- 27. C. F Glover, M. L. C. Lim, G. Post, M. Mayo, and J. R. Scully, Corrosion, 75, 1513 (2019).
- 28. W. Sun, G. Bian, L. Jia, J. Pai, Z. Ye, N. Wang, J. Qi, and T. Li, Metals, 13, 93 (2023).
- 29. Z. Cui, J. Li, D. Qiu, W. Yang, and Z. Zhang, Chem. Pap., 78, 263 (2024).
- 30. W. Zhan, W. Wang, Y. Li, X. Qian, and D. Wang, Surf. Coat. Technol., 475, 130173 (2023).
- 31. A. I. Stoica, J. Światowska, A. Romaine, F. Di Franco, J. Qi, D. Mercier, A. Seyeux, S. Zanna, and P. Marcus, Surf. Coat. Technol., 369, 186 (2019).
- 32. E. Chevallier, L. Augée, Q. Boyer, M. P. Labeau, and P. Moeau, J. Mater. Sci., 58, 1368 (2023).
- 33. L. L. Song, J. F. Li, and C. Cai, CEST, 51, 263 (2016).
- 34. E. Mysliu, K. S. Storli, H. M. Skogøy, S. Kubowicz, I. H. Svenum, O. Lunder, and A. Erbe, Electrochim. Acta, 477, 143805 (2024).
- 35. X. Verdalet- Guardiola, B. Fori, J. P. Bonino, S. Duluard, and C. Blanc, Corros. Sci., 155, 109 (2019).
- 36. V. Bonamigo Moreira, A. Puiggalí-Jou, E. Jiménez-Piqué, C. Alemán, A. Meneguzzi, and E. Armelin, Materials, 14, 1043 (2021).
- 37. A. Kraš and I. Milošev, J. Electrochem. Soc., 170, 021508 (2023).
- 38. A. Kraš, D. Kramar, and I. Milošev, Corros. Sci., 242, 112551 (2025).
- 39. A. Kraš, D. Kramar, and I. Milošev, Corros. Sci., 249, 112824 (2025).
- 40. P. Rodič, B. Kapun, and I. Milošev, npj Mater. Degrad., 8, 58 (2024).
- 41. M. Eslami, V. Pachchigar, M. Sankaran, and D. V. Krogstad, Appl. Surf. Sci., 697, 163018 (2025).
- 42. A. Yi, Y. Liu, J. Huang, J. Liu, X. Chen, M. Wang, and J. Xie, RSC Adv., 15, 6564 (2025).
- 43. M. A. Smit, J. A. Hunter, J. D. B. Sharman, G. M. Scamans, and J. M. Sykes, Corros. Sci., 46, 1713 (2004).
- 44. L. Li, A. L. Desouza, and G. M. Swain, Analyst, 138, 4398 (2013).
- 45. P. Droniou, W. E. Fristad, and J. L. Liang, Met. Finish., 103, 41 (2005).
- 46. X. Xia, I. Zhitomirsky, and J. R. McDermid, J. Mater. Process. Technol., 209, 2632 (2009).
- 47. R. Moore and B. Dunham, Met. Finish., 106, 46 (2008).
- 48. B. Dunham, Met. Finish., 110, 18 (2012).
- 49. M. Pourbaix, Atlas of Electrochemical Equilibria in Aqueous Solutions (National Association of Corrosion Engineers, Houston, Cebelcor, Brussels) (1974).
- 50. S. A. Kulinicha and A. S. Akhtara, Russ. J. Non-Ferr. Met., 53, 176 (2012).
- 51. I. Milošev and G. S. Frankel, J. Electrochem. Soc., 165, C127 (2018).
- 52. B. R. W. Hinton, Met. Finish., 89, 15 (1991).
- 53. T. Schram, G. Goeminne, H. Terryn, W. Vanhoolst, and P. Van Espen, Trans. Inst. Met. Finish., 73, 91 (1995).
- 54. Y. Liu, Y. Yang, C. Zhang, T. Zhang, B. Yu, G. Meng, Y. Shao, F. Wang, and L. Liu, J. Electrochem. Soc., 163, C576 (2016).
- 55. L. Li, G. P. Swain, A. Howell, D. Woodbury, and G. M. Swain, J. Electrochem. Soc., 158, C274 (2011).
- 56. M. Mujdrica Kim, B. Kapun, U. Tiringer, G. Šekularac, and I. Milošev, Coatings, 9, 563 (2019).
- 57. W. K. Chen, J. L. Lee, C. Y. Bai, K. H. Hou, and M. D. Ger, J. Taiwan Inst. Chem. Eng., 43, 989 (2012).
- 58. G. S. Frankel, R. G. Buchheit, M. Jaworowski, and G. Swain, SERDP Project WP-1620, (2013), (accessed on January 2024), https://apps.dtic.mil/sti/tr/pdf/ ADA582500.pdf.
- 59. T. K. Shruthi and G. M. Swain, J. Electrochem. Soc., 165, C103 (2018).
- 60. J. Qi, T. Hashimoto, J. Walton, X. Zhou, P. Skeldon, and G. E. Thompson, J. Electrochem. Soc., 163, C25 (2016).
- 61. Y. Guo and G. S. Frankel, Surf. Coat. Technol., 206, 3895 (2012).
- 62. L. Li, D. Y. Kim, and G. M. Swain, J. Electrochem. Soc., 159, C326 (2012).
- 63. J. Qi, A. Němcová, J. R. Walton, X. Zhou, P. Skeldon, and G. E. Thompson, Thin Solid Films, 616, 270 (2016).
- 64. ASTM International, “ASTM G59-97(2020).” Standard test method for conducting potentiodynamic polarization resistance measurements (2023).
- 65. G. M. Brown, K. Shimizu, K. Kobayashi, G. E. Thompson, and G. C. Wood, Corros. Sci., 34, 1045 (1993).
- 66. I. Schoukens, J. Vandendael, A. A. Saleh, H. Terryn, and I. De Graeve, Surf. Coat. Technol., 235, 628 (2013).
- 67. X. Chen, G. Li, J. Lian, and Q. Jiang, Surf. Coat. Technol., 204, 736 (2009).
- 68. J. T. Qi, T. Hashimoto, J. R. Walton, X. Zhou, P. Skeldon, and G. E. Thompson, Surf. Coat. Technol., 280, 317 (2015).
- 69. G. Šekularac, J. Kovač, and I. Milošev, J. Electrochem. Soc., 167, 111506 (2020).
- 70. NIST X-ray Photoelectron Spectroscopy Database. https://srdata.nist.gov/xps/, 2024 (accessed on 21 December 2024).
- 71. A. Samaei and S. Chaudhuri, Electrochim. Acta, 433, 141195 (2022).