


Corrosion of electrolytically gilded silver was analyzed. Red spots were observed after eight months’ storage in an indoor environment.
 Gold chloride (AuCl3) was identified as the origin of the corrosion phenomenon, which is attributed to contamination coming from the electroplating processes. Optical microscopy, scanning electron microscopy (SEM), X-ray photoelectron spectroscopy (XPS) and Auger electron spectroscopy (AES) techniques were utilized.
Gilded silver has been widely used for decorative effects as an economical alternative to solid gold. It is known that irrespective of the gilding procedure used (fire gilding or gold electrodeposition), gilded silver can suffer damage after a short time because of silver diffusion through the gold layer. In an environment with sulfur contamination, sulfuration processes can occur, yielding a blackish layer.1
As a noble metal, silver offers high corrosion resistance and is easily protected by a passive film in different environments. Silver also has a tendency to form complex ions in solution.2 The aim of this paper is to analyze the origin of corrosion spots of red color which had appeared on gilded silver figures stored for a period of eight months in an apparently pollution-free environment. A palladium preplate had been applied prior to the deposition of the gold coating. Finally, the figures had been protected with an invisible passivation layer by immersion in an organic solution.
Editor’s note: this paper was originally published in 2001.
Materials and Methods
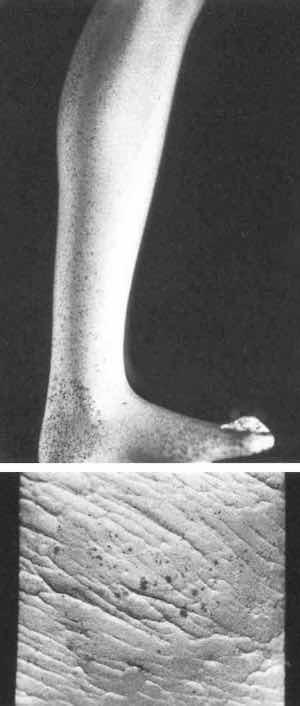 Fig. 1—Gilded silver with corrosion spots.Figure 1 shows a leg of a gilded silver figure (~20 cm high) and a gilded silver sheet (1 x 1 cm) upon which some corrosion spots of red color were observed after eight months of storage in an unpolluted environment. Figure 2 shows a similar sheet (1 x 1 cm) without corrosion. Experimental specimens tested were of 1 cm2 surface area.
The metallic silver substrate (99.95% purity) was treated in a silver workshop using the following procedure: Degreasing in trichloroethylene vapor degreaser, cathodic cleaning using trisodium phosphate, sodium carbonate, sodium metasilicate, sodium hydroxide and liquid soap, plus acid pickling using dilute HCl medium (1:3) and water rinse. These treatments were followed by: (1) silver substrate immersion in a “silver plating bath” (silver cyanide 25 g/L, potassium cyanide 45 g/L, potassium carbonate 35 g/L, calcium hydroxide 1 g/L) at a potential of 0.5 V for ~3 min; (2) application of a mild metallic gold spray; (3) immersion in a “palladium plating bath” (palladium(II) chloride 50 g/L, ammonium chloride 30 g/L, ~40% hydrochloric acid 0.1 L/L) at a potential of 0.5 V for approximately three min, (4) immersion in a gold plating bath (tri-potassium citrate 120 g/ L, citric acid 20 g/L, metallic gold 8 g/L) at a potential of 0.5 V for approximately 15 min and, finally, (5) the specimens were protected at the end of gilding treatment by immersion in an organic solvent, 2-butoxyethanol and a small amount of water, for 15 min at 40°C.
Optical microscopy was used to determine the thickness of the layers obtained during gilding treatment [(1) to (5)]. Scanning electron microscopy (SEM) and energy dispersive X-ray (EDX) techniques were utilized to observe the surface morphology and to identify the composition of the layers formed. X-ray photoelectron spectroscopy (XPS) experiments were conducted to determine surface chemical composition with an Mg K 1.2 Xray source (hv = 1253.6 eV), with a primary beam energy of 15 kV and an electron current of 20 mA. The pressure in the analysis chamber was maintained at 1 x 10⁻⁹ Torr throughout the measurements. The regions of interest were O 1s, C 1s, Au 4f, Cl 2p and Na 1s.
Finally, Auger electron spectroscopy (AES) was used to characterize the gilded silver surfaces. AES was performed using the spectrophotometer described above, connected to a source with a primary beam energy of 3 kV and a beam current of 2 x 10⁻⁶ A, and with a base pressure of 1 x 10⁻⁹ Torr.
Results and Discussion
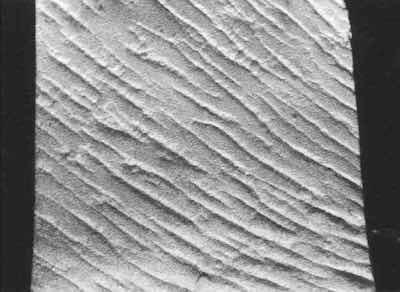 Fig. 2—Gilded silver without corrosion.Optical microscopy experiments of the specimens shown in Figs. 1 and 2 yielded the following thickness of the layers obtained in plating treatments (1) to (5): an inner layer of ~0.6 - 0.8 mm of gray color, an intermediate layer of ~3 mm of yellow color, and an outer layer of ~3 mm with a blackish color.
Figure 3a shows a SEM micrograph for a corroded specimen. The surface of the sample is very irregular and porous. Some darker zones can be observed, corresponding to the red spots. Figure 3b shows a magnification of one of these spots. Some bulky corrosion products can be seen over the gold layer.
Figure 4a shows an EDX spectrum for the gold layer outside the dark spots; only the signal for gold can be seen. In contrast, the EDX spectrum in Fig. 4b, corresponding to the corrosion products, shows Au, Ca, K, Cl, Si and Na signals. The presence of Cl suggests that the cause of corrosion spots may be attributed to some chlorine compound. The source of Ca, K, Si and Na signals may be attributed to the different chemical compounds utilized in the electroplating processes.
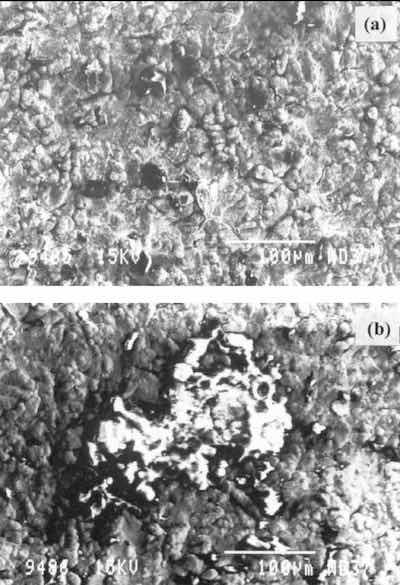 Fig. 3—SEM results for a corroded specimen.EDX spectra (Fig. 4) do not show signals from the silver substrate or the palladium preplate, indicating that the gold layer entirely covers the surface of the specimen and that its thickness is greater than the depth of EDX analysis (~1 mm). EDX data on corroded specimens and the AES spectra (not included) agree with the results shown in Fig. 4.
Figure 5 shows high-resolution XPS spectra for C, O, Au, Cl and Na of a corroded specimen. The carbon spectrum (Fig. 5a) shows four components at 284.6, 286.1, 287.6 and 288.6 eV, which can be attributed to C-C, C-O, C=O and O-C=O bonds, respectively, of the passivating organic layer. The two components of the oxygen spectrum (Fig. 5b) at 531.5 and 532.8 eV can also be attributed to the O-C and O=C bonds, respectively, of the same organic layer. Gold peaks (Fig. 5c) show a component at 83.8 and 87.5 eV, corresponding to the metallic gold, and a second small component at 84.4 and 88.1 eV, that may be attributable to a gold chloride compound. Because of the very low analysis depth of the XPS technique (10-30 Å), the presence of the gold signal may indicate that the passivating organic layer is not covering the entire surface of the gold. The chlorine spectrum (Fig. 5d) shows a peak at 198.5 eV that can be attributed to a chloride compound. Finally, the sodium spectrum (Fig. 5e) shows a peak at 1072 eV, corresponding to sodium chloride. Using the atomic sensitivity factors and subtracting the NaCl contribution from the Cl peak, the Cl/Au atomic ratio is approximately 3, which corresponds to gold(III) chloride (AuCl ).3
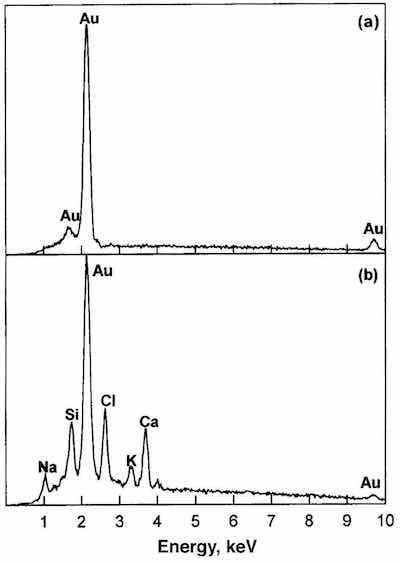 Fig. 4—EDX results for the corroded specimen of Fig. 3.The relative humidity and temperature of the storage room may have contributed to condensation phenomena, favored by the porosity of the surface, leading to deterioration of the gilded surface layer. In this study, indoor atmospheric corrosion was observed after a short time (8 months) of storage in an apparently unpolluted atmosphere at room temperature. The presence of chlorine may result from contamination of the gilded layer coming from the electroplating processes.
Findings
Three layers were observed using the optical microscopy technique on corroded specimens: an inner layer ~0.6-0.8 mm thick of gray color, an intermediate layer ~3 mm thick of yellow color, and a third outer layer ~3 mm of blackish color. The morphology of the gilded layer is of porous nature.
This favors retention of chloride-containing residues of the electroplating baths, which react with the gold layer to form a red gold(III) chloride compound. The four complementary analytical techniques SEM, EDX, XPS and AES yield concordant results, with C, O, Au and Cl as main elements.
About the Authors
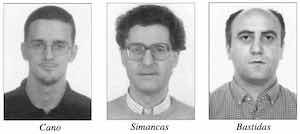
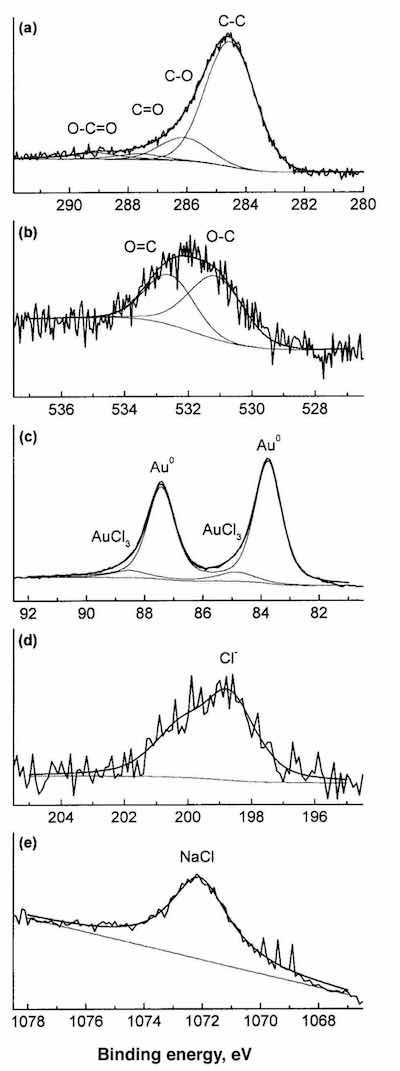 Fig. 5—XPS high-resolution spectra for a corroded specimen.Emilio Cano is a post-graduate researcher at the National Metallurgical Center (CENIM) of the Spanish Council of Scientific Research (CSIC), where he is pursuing a PhD (copper corrosion). He holds an honors degree in fine arts from the Complutense University of Madrid and has published several papers in the area of corrosion.
Dr. Joaquin Simancas is a research assistant at the National Metallurgical Center (CENIM). He holds a PhD in chemistry and has published more than 40 papers. His specialty is surface analysis techniques (XPS and AES).
Dr. José-Maria Bastidas is a senior researcher at the National Metallurgical Research Center (CENIM). Avda Gregorio del Amo 8, 28040 Madrid, Spain. He holds a PhD in chemistry and has been involved in numerous projects on mild steel, stainless steel, copper and tin materials. His main areas of interest are atmospheric and pitting corrosion. He has published more than 150 papers.
Acknowledgment: Author E. Cano expresses gratitude to the Spanish Ministry of Education and Culture for the scholarship granted to him.
References
- C. Degrigny, M. Wéry, V. Vescoli & J.M. Blengino, Stud. Conserv., 41, 170 (1996).
- G.W. Walkiden, R.A. Jarman, in Corrosion, L.L. Shreir, R.A. Jarman & G.T. Burstein, Eds., Butterworth Heinemann, London, 1994; p. 6:9.
- J.F. Moulder, W.F. Stickle, P.E. Sobol & K.D. Bombem, in Handbook of X-ray Photoelectron Spectroscopy, J. Chastain, Ed., Perkin-Elmer, Eden Prairie, MN, 1992.