


Uniformity of metal deposition is crucial in electrodeposition processes since it directly influences coating performance, corrosion resistance, and mechanical durability, especially for components with complex geometries.
This study evaluates and compares the throwing power (TP) and throwing index (TI) of three commonly used zinc electroplating baths —chloride, sulphate, and acetate- under controlled conditions. A Haring-Blum cell was used for TP measurements, and TI values were calculated from metal distribution ratios across different cathode distances. Potentiodynamic cathodic polarization curves were also recorded to help correlate electrochemical behavior with deposition uniformity.
The zinc chloride bath consistently demonstrated superior TP (14.28 – 60.0) and TI (1.33–4.0) across a wide range of zinc salt concentrations, current densities, and pH values, owing to its higher conductivity and enhanced polarization behavior. Sulphate-based baths exhibited moderate TP (5.26–33.33) and TI (1.0–2.32) with significant sensitivity to operating conditions, whereas acetate-based baths exhibited the lowest TP (5.26–14.28) and TI (1.0–1.66), most likely due to limited ion mobility and conductivity.
Microstructural and surface characterization confirmed these findings, with the chloride bath exhibiting the most balanced performance in terms of hardness, morphology, and coating uniformity. These results lay the groundwork for improving zinc-electroplating baths to achieve better coating longevity, corrosion resistance, and dependable performance in industrial applications that demand high surface coverage and exact thickness control.
1. Introduction
Zinc coatings are a low-cost and efficient way to protect steel from corrosion, making them widely used in industrial applications. Furthermore, zinc and its alloys possess considerable practical importance and are extensively utilized in various energy storage systems [1], [2], [3] such as lithium-ion batteries [4], [5]. These coatings can be made using hot-dip galvanizing or electrodeposition, with the latter being preferred due to its ability to control coating thickness, appearance, and operation at ambient temperatures. Acid electrolytes, in which the metal ions to be discharged are present in simple or hydrated form in relatively high concentration, nearly always have a lower throwing power (TP) than alkaline electrolytes, in which the dischargeable complexes are usually present in low concentration. The alkaline (usually cyanide) electrolytes, therefore, have a much higher concentration polarization than acid electrolytes with their normally high concentration of dischargeable ions [6]. While cyanide-based baths provide high TP and brightness, their toxicity has prompted efforts to develop safer alternatives. Acid-based systems are less hazardous but have lower TP and require optimization to achieve uniform metal distribution, particularly on complex geometries.
Throwing power is the ability of a plating bath to deposit metal uniformly over irregular cathode surfaces. Therefore, it is important when plating hollow or recessed objects, such as cylinders, because it determines the plating solution's ability to deposit evenly on inner surfaces and hard-to-reach areas. The TP of an electrolyte bath is good when the distribution of the deposit is uniform and poor when it is not uniform. In many cases, maximum uniformity of the deposit distribution is desirable, i.e., good TP of the electrolyte. The percentage ratio of the smallest and greatest coating thickness at two particular points of the object may be used as a measure of the TP [7].
It is determined by the bath conductivity, polarization behavior, and current distribution across the substrate. The classical Haring-Blum cell is frequently used to quantify TP by comparing metal depositions at cathodes spaced at different distances from the anode. In the absence of polarization, current distribution follows Ohm's law; however, polarization introduces secondary effects that, when optimized, can improve uniformity [6], [8], [9].
Numerous studies have investigated ways to improve the TP in metal electrodeposition, particularly for achieving uniform coatings on complex and recessed geometries. Much of this research has focused on modifying bath composition and incorporating additives to enhance polarization behavior and current distribution [10], [11], [12], [13].
In copper electroplating, several additive systems have been shown to have a significant impact on TP. For example, the combination of chloride ions, gelatine, and thiourea changes the characteristics of the deposition process and the resulting surface morphology [7], [8], [9], [10].
Gelatin and chloride increased polarization and TP, whereas higher thiourea concentrations reduced polarization but decreased TP [7], [12], [13], [14]. Similarly, suppressors such as iodonitrotetrazolium (INT) in copper baths for flexible printed circuits have been shown to significantly improve TP by promoting a concentration gradient between through-hole entrances and sidewalls, allowing for uniform deposition. The experimental data agreed well with the simulation results, confirming the mechanism. Polyethylene glycol (PEG) was an effective suppressor in copper systems, improving cathodic polarization and controlling crystal growth, thereby reducing thickness variation and increasing TP [1], [5], [10], [14], [15], [16].
Ibrahim et al. improved zinc sulphate baths by synergism of additives; ninhydrin and iodide ions. Each additive significantly increased TP by about five times; mixing the two additives increased TP seven times greater [7], [10]. Additives p-anisidine (PA) and sodium dodecylbenzenesulfonate (DBS) significantly increased the overpotential for Zn2⁺ reduction, improving TP by factors of 4, 1.5, with DBS and with PA, respectively. The bath formulation, additive synergism, and electrochemical control significantly affected TP values [7], [10], [15].
The synergism of organic additives, including polyquaternium-2 (PUB) and 1-benzylpyridinium (BPC), in the alkaline non-cyanide zinc electroplating process was investigated. The results demonstrated that the presence of such compounds improves the TP [11], [12]. The influence of carrier, leveler, and concentration of booster on the zinc electroplating process from alkaline zincate baths was examined. It was found that TP ranged from 18 % to 37 % depending on the additive mixture [13]. However, such additives are added carefully to avoid a decrease in the TP. For example, the addition of L-cysteine or monosodium glutamate decreases the TP of acidic zinc sulphate baths [15], [16], [17].
However, direct comparisons of TP across the most used zinc plating baths-sulfate, chloride, and acetate are still lacking, as reported in previous studies. This study aims to evaluate and compare the TP of sulphate, chloride, and acetate zinc electroplating baths in controlled conditions. It also aims to identify the key operational parameters that govern TP to improve bath performance for uniform metal deposition.
2. Experimental
2.1. Materials
The three selected zinc bath compositions and their operating conditions for chloride, sulphate, and acetate are given in Table 1. All the chemicals are analytical grades, and all solutions were prepared using distilled water.
Table 1. The composition and the operating conditions of varying zinc plating baths at 25 °C.
| Bath | Composition | Operating conditions |
| Chloride | 100 g/L ZnCl2; 50 g/L NaCl | t = 10 min; I = 0.95 A/dm2; pH 2.11 |
| Sulphate | 120 g/L ZnSO4.7H2O; 60 g/L Na2SO4 | t = 10 min; I = 0.95 A/dm2; pH 4.72 |
| Acetate | 150 g/L Zn (CH3COO)2.2H2O; 75 g/L CH3COONa | t = 15 min; I = 1.4 A/dm2; pH 6.32 |
2.2. The throwing power and the throwing index
The throwing power of the solution was determined using Haring–Blum rectangular Perspex (12 cm × 3.5 cm × 2.5 cm) containing a solution of fixed depth and equipped with a single anode positioned between two parallel cathodes, with a far-to-near distance ratio of 3:1. The percentage of TP was then calculated according to Field's equation as reported in previous studies [7], [8], [11], [12], [18].
TP% = (L− M/L +M− 2 ) × 100 (1)
Here, L represents the current distribution ratio (linear ratio, 3:1), while M denotes the metal distribution ratio between the near and the far regions of the cathodes. The values of M were determined as a function of L across a wide range of linear ratios, varying from 1:1 to 5: 1. The throwing index (TI) for each bath was defined as the reciprocal of the slope obtained from M versus L relationship. To assess geometric influences, the Haring–Blum geometry was defined with an initial configuration of L = 3:1 and systematically varied between 1:1 and 5:1. The cell is divided into several equal distances to position the electrodes via special grooves. For TP measurements, the distance between the cathodes was 1:3; however, for TI measurements, the distances changed from 1:1–1:5 (Five experiments at different L) [4], [7], [8], [17], [18].
Field's equation was used to calculate TP, and assuming local linearity within the studied range, TI was calculated as the reciprocal slope of M versus L. The TP and TI were determined in triplicate, and the average values were taken. Field's formula for TP% has limitations due to its reliance on the particular geometry and measurement points and assumption of a simplified current distribution. Field's TP% is constrained. As a result, it is not a reliable representation of actual plating behavior on complex parts. However, it could be useful in comparison between different electrolytic solutions. TI is more accurate than TP since TI is measured using five experimental points in comparison with one experiment in the case of TP measurement [18], [19].
2.3. Potentiodynamic polarization curves
Electrochemical investigations were conducted using the 1000 Gamry Instrument Potentiostat/Galvanostat/ZRA. The electrochemical parameters were determined using the Echem Analyst software from Gamry Instruments. The cathodic polarization curves were obtained using copper sheets by applying a negative potential scan with a rate of 5 mV s−1. The reference electrode used in this study was an Ag/AgCl electrode, a platinum wire as the auxiliary electrode, and a copper sheet as the working electrode.
2.4. Characterization of zinc deposits
A JEOL JEM-1200EX scanning electron microscope was employed to analyze the surface morphology of the zinc coatings. The microstructure of the deposits was characterized using a Shimadzu XRD-6000 diffractometer (40 kV, 30 mA). Additionally, the microhardness of the zinc coatings was evaluated using a Vickers or Knoop diamond tester (model HWDM-7). During the test, a diamond pyramid was indented into the coating surface under a load of 25 g for 15 s, and the diagonal of the indentation was measured after unloading. The microhardness values, expressed in kg/mm2, were calculated in each case using the following Eq. (2). The average value of five measurements was taken [20].
Hv = 1.854 × U/d2 (2)
Where U represents the applied load in grams and d denotes the diagonal length of the indentation in micrometers.
The coating thickness (d) in meter was calculated using Eq. (3). In this equation, Faraday’s laws predicted the Zn film’s mean thickness “d” meter [15], [16], [21]:
d = Mit/ nFρA (3)
where I is the current that flows in amperes, t is the time in sec., M is the molar mass (g/mol), = Faraday constant (96,485 C/mol), A is the electroplated area (m2), n is the number of electrons, and = density of Zn (g/m³).
Where A denotes the surface area subjected to electrodeposition (dm2), I is the current in amperes, and the time in hours. A conductometer model (STAR A215) measured the conductivity of different baths, and the pH of the solutions was measured by a pH 211-microprocessor pH meter [21].
3. Results and discussion
The soluble salts of the simple strong acids, sulfuric, hydrochloric, and nitric acids, are usually similar in many properties. Sulphates and chlorides are the most commonly used in plating baths. Nitrates are seldom used because the nitrate ion, NO3-, may be reduced at the cathode to form ammonia, NH3, and thus change the composition and pH of the bath. If the metal-ion concentration were the only consideration, we should expect to get very similar results with chlorides and sulphates of a given metal, such as iron, nickel, tin, or zinc. It is found that there are often marked differences in the behavior of chloride and sulphate baths, e.g., of nickel, which cannot be accounted for by their solubilities or their dissociations and resultant metal-ion concentrations. These differences are especially marked when certain addition agents are used. It is necessary, therefore, to conclude that the anions in a bath may affect their operation, e.g., by affecting the form of colloids in the cathode film. No sound predictions can be made [15], [16], [17].
3.1. Potentiodynamic cathodic polarization curves
In general, polarization affects the throwing power of the bath (Fig. 1) in such a way that the greater the slope of the polarization curve (i.e., the more nearly horizontal), the better the with that of the sulphate bath. An increase in cathodic polarization tends to produce finer-grained deposits. An increase in hydrogen overvoltage retards the evolution of hydrogen and thus fosters metal deposition. The most familiar illustration of this effect is the fact that zinc can be deposited with good efficiency from acidified baths. If the hydrogen were discharged at its equilibrium potential, the current would be used principally in depositing hydrogen. Because of the high overvoltage of hydrogen on zinc, the latter is deposited along with some hydrogen. In general, the overvoltage curve for hydrogen and oxygen in a given bath influences the anode and cathode efficiencies, especially of metals less noble than hydrogen [13], [21].
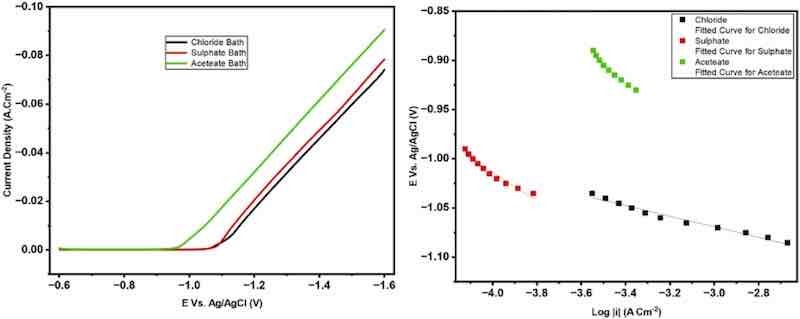
Fig. 1. The potentiodynamic cathodic polarization curves during zinc electrodeposition from various baths scan rate 5 mV s−1.
Cathodic polarization plays a crucial role in determining the throwing power (TP) of an electroplating bath, as it, in combination with the ohmic resistance, governs the distribution of the plating current and consequently influences the uniformity of metal deposition across different regions of the cathode. Therefore, the potentiodynamic cathodic polarization for zinc electrodeposition was measured for the different baths. The curves were swept from the rest potential (approximately − 0.6 V) to − 1.6 V vs. Ag/AgCl at a scan rate of 5 mV s−1. The data reveal that the polarization during zinc deposition from the chloride bath is higher than that from the sulfate bath. At the same time, the lowest value is observed in the case of the acetate bath [10], [13], [17].
Based on the calculated Tafel slopes, clear differences in cathodic kinetics parameters are observed among the three aqueous baths. The acetate bath exhibits the lowest value of βc, which reflects low polarization. In contrast, the chloride bath shows a higher value of βc corresponding to higher polarization. The sulfate bath presents the medium value of βc, which means medium polarization. In general, factors that contribute to increasing polarization positively influence the throwing power of electrolyte baths. Moreover, enhancing the electrolyte’s conductivity leads to a uniform current distribution, thereby improving the overall throwing power [7], [8], [12], [18]. Extrapolating the Tafel regions from the polarization curves yielded the cathodic transfer coefficient (αc). Experimental uncertainties and small deviations from ideal Tafel behavior cause small variations in the measured βc values, but they have little effect on the calculated αc, which is constant under all conditions examined. Similar results of nearly identical αc despite different Tafel slopes are recorded in the literature [17], [19].
The unique impact of chloride ions on cathodic polarization gives the chloride bath its superior throwing power. The overpotential for zinc nucleation is increased when chloride ions adsorb on the cathode surface, which inhibits localized growth and encourages uniform deposition. Furthermore, unlike sulfate or acetate ions, which have weaker polarization effects, chloride promotes the formation of soluble zinc-chloro complexes, moderating reduction kinetics and improving metal distribution across recessed and high-resistance areas [22], [23], [24]. The chloride shows higher cathodic polarization than sulfate/acetate (Fig. 1 and Table 2). This finding was attributed to the fact that Zn²⁺-Cl⁻ complexes are more labile and deplete at the interface more quickly, causing earlier concentration polarization, and chloride baths exhibit higher cathodic polarization for zinc. Under the same conditions, acetate and sulfate form more strongly hydrated Zn2+ species that polarize less [6], [15], [25].
Table 2. Tafel kinetic parameters obtained for zinc from different electrolytic baths.
| Bath | -βc V decade−1 | αc | Io(A cm−2) |
| Chloride | 0.201 | 0.08 | 0.00097415 |
| Sulfate | 0.146 | 0.08 | 0.0010019 |
| Acetate | 0.054 | 0.09 | 0.0011178 |
3.2. Throwing power performance of zinc electrolytes
The TP of the zinc-plating bath was measured using a Haring–Blum cell, the TP values calculated by Field’s empirical formula at a distance ratio of 1:3. Another way of expressing the TP of the plating bath is the TI. The TI was determined by plotting the metal distribution ratio M, and the linear ratio L (1: 1–1: 5) as shown in Fig. 2, Fig. 3, Fig 4. The reciprocal of the slopes of these lines is the TI and represents a measure of bath TP. It should be noted that a solution with excellent characteristics would produce a horizontal line at M = 1 [7], [8]. The TI measures the TP of the bath, which is the reciprocal of the slopes of these lines. In this diagram, a bath with a low TP would result in a very steep line, whereas an ideal solution would result in a horizontal line at L = 3.0. There are several benefits to the manifestation of TP as TI. One number, for instance, that is characteristic of several different linear ratios is discovered. Additionally, TI is calculated from several experimental spots, which reduces measurement errors overall. The effects of the following variables (concentration, pH, and current density) on the TP and TI of various baths, chloride, sulphate, and acetate baths are depicted in Fig. 2, Fig. 3, Fig 4 and Table 3, Table 4, Table 5 [1], [11], [18].
![Fig. 3, Fig 4 and Table 3, Table 4, Table 5 [1], [11], [18].](/images/images/whitepapers/zincthrow/2.jpg)
Fig. 2. The metal distribution M vs linear ratio for zinc chloride bath at different operating conditions.

Fig. 3. The metal distribution M vs linear ratio for zinc sulphate bath at different operating conditions.
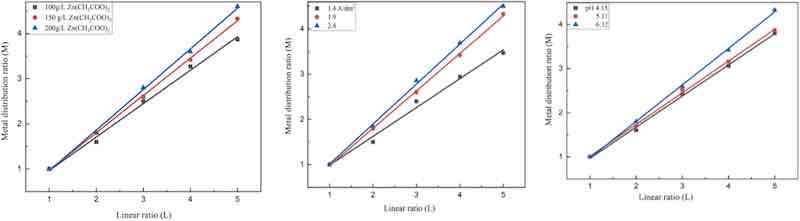
Fig 4. The metal distribution M vs linear ratio for zinc acetate bath at different operating conditions.
Table 3. The effect of zinc salt concentrations on the TP, TI and conductivity for different baths.
| Bath | Zinc salt concentration(g/L) | TP % | TI | Conductivity(mS) |
| Chloride | 100–200 | 14.28–60 | 1.33–4 | 116–125 |
| Sulphate | 90–150 | 5.26–33.33 | 1–2.32 | 61.62–64.27 |
| Acetate | 100–200 | 5.26–14.28 | 1–1.66 | 28.39–33.6 |
Table 4. The effect of current densities on the TP and TI for different baths.
| Bath | Current density (A/dm2) | TP % | TI |
| Chloride | 0.95–1.29 | 0–60 | 0.86–4 |
| Sulphate | 0.48–1.4 | 6.66–53.84 | 1.05–3.33 |
| Acetate | 1.4–2.38 | 3.62–17.64 | 1.23–1.89 |
Table 5. The effect of pH on the TP, TI, and conductivity for different baths.
| Bath | pH | TP % | TI | Conductivity(mS) |
| Chloride | 2.1–5.1 | 42–60 | 2.08–4 | 116–124 |
| Sulphate | 3.37–4.72 | - 42.8 to 23.07 | 0.4–1.29 | 63.65–64.27 |
| Acetate | 4.15–6.32 | 11.11–16.72 | 1.1–1.35 | 32.81–50.02 |
Based on the geometry of the Haring Blum cell, the total current is distributed between two partial currents corresponding to the two cathodes. In the absence of the polarization effects, the primary current ratio ( /) is governed by the electrical resistance of the electrolyte between the anode and each cathode. This ratio is inversely proportional to the respective distances from the anode; therefore, the primary current ratio is expected to be equal to the distance ratio L. As current flows through the cell, polarization occurs, which is generally greater at the cathode closer to the anode than at the more distant one. Since the polarization resistance can be considered in series with the ohmic resistance, the current at the nearer cathode is reduced in a uniform secondary current distribution. Enhancing the conductivity of the electrolyte bath can further promote a more balanced distribution of the current ratio [7], [8], [11], [18].
The primary cause of the TP drop to 0 % at 1.9 A/dm² is severe concentration polarization: deposition stops in low-current-density areas because metal ions are depleted there. The non-uniformity worsens as hydrogen evolution increases and competes for current. Instead of a shift in the deposition mechanism, this reflects mass-transport limits [19], [23], [24], [25].
The negative TP is already established in literature when the electrolytic solution has poor throwing power [4]. Negative TP could be obtained when M (Metal distribution ratio) is greater than L (Linear ratio) according to Field’s equation. Throwing power (TP) is an essential parameter in electrodeposition processes because it measures an electrolyte's ability to achieve uniform metal distribution across complex and recessed substrate geometries. TP is typically measured in both Throwing Power (%) and Throwing Index (TI), with higher values indicating better deposition uniformity. This study analyzed the TP performance of three zinc-based electrolytes: zinc sulphate (SO₄²⁻), zinc acetate (CH₃COO⁻), and zinc chloride (Cl⁻) in relation to zinc salt concentration, current density, and pH levels. The corresponding results were collected in Table 3, Table 4, Table 5.
TI shows how little the thickness of the deposit varies with the distance. Even in recessed areas, a higher TI indicates more consistent plating and improved innate throwing ability. TI is less reliant on test geometry or selected measurement points than TP%. It is more dependable for comparing various baths and forecasting performance on intricate parts since it captures the inherent behavior of the plating system [7], [12], [18].
The chloride bath shows the best TP, but the chloride-based zinc baths have practical limitations in industrial applications, despite their superior throwing power. Elevated levels of chloride can corrode stainless steel machinery, encourage the evolution of hydrogen, lower current efficiency, and possibly result in porous deposits. Additionally, the baths frequently require precise additive control to maintain uniform deposition, and chloride-containing effluents present environmental challenges requiring careful treatment and disposal. Sulfate and acetate baths, on the other hand, have lower throwing power and require optimization to achieve uniform coatings on complex geometries, but they are less aggressive and more environmentally benign [22].
3.2.1. Effect of zinc salt concentration
As shown in Fig. 2, Fig. 3, Fig 4 and Table 3, the zinc chloride electrolyte had the highest TP, TI across the concentration range studied, with a maximum TP of 60 %, and TI of 4.0 at 100 g /L. Superior performance indicates improved ionic conductivity and Zn²⁺ ion transport, resulting in uniform deposition even at lower concentrations. In contrast, the sulphate-based bath had moderate TP values that decreased significantly at higher zinc concentrations. This behavior is most likely due to increased ionic crowding and polarization effects, which impede ion migration and deposition uniformity. The acetate bath consistently had the lowest TP and TI, indicating poor leveling properties, possibly due to limited ion mobility and lower conductivity despite higher salt concentrations [23], [24], [25].
3.2.2. Effect of current density
Fig. 2, Fig. 3, Fig 4 and Table 4 show how current density influences TP and TI. All three electrolytes showed a general trend of declining TP as current density increased. This behavior can be explained by the accelerated rate of metal ion reduction at high current densities, which favors deposition in high-field (edge) regions while reducing leveling in recessed areas. The chloride electrolyte initially had the highest TP at lower current densities but experienced a steep decline, reaching 0 % TP at 1.9 A/dm², indicating concentration polarization at high current loads. At intermediate current densities, the sulphate bath outperformed the acetate system in terms of TP. However, beyond 1.0 A/dm², the TP decreased significantly. The acetate electrolyte had consistently low TP values across the current density range, highlighting its limitations in high-uniformity applications [17], [18].
3.2.3. Effect of pH
Fig. 2, Fig. 3, Fig 4 and Table 5 describe how pH affects TP and TI. The chloride system outperformed the other two electrolytes across the pH range studied, maintaining high TP values and demonstrating its resistance to acid changes. The high ionic conductivity and efficient Zn replenishment at the cathode surface allow for stable deposition under varying pH conditions. In contrast, the sulphate electrolyte demonstrated strong pH sensitivity, with TP values becoming negative at low pH, indicating severe edge effects and poor metal distribution. The acetate bath had moderate TP values and relatively stable trends across the pH range, indicating some buffering capacity. However, its total TP was significantly lower than that of the chloride system [6], [11], [13], [22].
3.2.4. Comparative analysis and application suitability
Under all conditions tested, the chloride-based electrolyte consistently outperformed the others in terms of throwing power. This is due to its high conductivity and enhanced Zn⁺ ion mobility, resulting in improved field uniformity and efficient ion transport to recessed deposition sites [25].
Sulphate electrolytes, while providing moderate TP under ideal conditions, are extremely sensitive to concentration and pH, limiting their process window. The acetate system, while operationally safer and exhibiting some buffering stability had the poorest TP performance, most likely due to low ionic strength and limited potential gradients required for effective leveling [7], [9], [13].
These findings indicate that chloride-based zinc baths are best suited for applications that require high deposition uniformity and coverage across complex geometries. Sulphate-based systems can be used where moderate TP is acceptable, if the pH and current density are carefully controlled. Acetate-based electrolytes are better suited to less demanding applications in which operator safety and bath stability are more important than deposition uniformity [7], [9], [11], [13].
The correlation between current density and current efficiency plays a significant role in determining the throwing power of an electroplating bath. At 100 % current efficacy, the throwing power is given by the secondary current distribution, which is in turn determined by the polarization and electrolyte conductivity. A current efficiency under 100 % can have an equalizing effect on the metal distribution by the secondary current distribution [10], [11], [12], [13], [14], [15], [25].
With most acid electrolytes, the effect of the current efficiency (%F) on the TP is not very important because a current density range is used, in which the current efficiency is 100 % or only a little less. It was found that in most of the studied baths in this investigation, the percentage F was close to 100 % [25].
3.3. Surface characterization
3.3.1. Microhardness
Table 6 collected the operational conditions and the obtained data.
Table 6. The average microhardness and thickness of zinc plated from various baths at different operating conditions (25 °C).
| Bath | Operating conditions | Average micro-hardness (Hv) | Crystal size (nm) | Thickness (µm) |
| Chloride | 100 g/L ZnCl2; 50 g/L NaCl; time 10 min; I = 0.95 A/dm2; pH 2.11. | 48.1 | 2.71 – 4.07 | |
| Sulphate | I= 0.48 A/dm2; time 10 min; pH4.72; 120 g/L ZnSO4+ 60 g/L Na2SO4 | 54.64 | 1.36 – 2.71 | |
| 120 g/L ZnSO4+ 60 g/L Na2SO4; pH4.72; I 0.95 A/dm2; 10 min. | 49.84 | 24.17 | ||
| 90 g/L ZnSO4+ 60 g/L Na2SO4; pH4.72; I 0.95 A/dm2; 10 min. | 42.52 | |||
| Acetate | 150 g/L Zn(CH3COO)2; 75 g/L CH3COONa; 15 min; 1.4 A/dm2; pH 6.32. | 46.7 | 6.1 – 8.13 | |
| 100 g/L Zn(CH3COO)2; 75 g/L CH3COONa; 15 min; I 1.9 A/dm2; pH 6.32. | 35.4 | 42.05 | ||
| 150 g/L Zn(CH3COO)2 75 g/L CH3COONa; 15 min; 1.9 A/dm2; pH 4.15 | 55.8 |
The data in Table 6 show how bath composition and operating conditions affect the microhardness and coating thickness of zinc-electroplated layers. The acetate bath produced the thickest coatings, ranging from 6.58 to 10.97 µm, especially with 150 g/L Zn (CH₃COO)₂·2H₂O and a current density of 1.4 A/dm². The bath had varying microhardness values, with the highest being 55.8 Hv at a lower pH of 4.15 and higher current density (1.9 A/dm²), indicating that pH and current density have a significant impact on hardness. The sulphate bath resulted in thinner coatings (2.91–4.37 µm) and decreased microhardness as current density increased, from 54.64 Hv to 42.52 Hv. This suggests that higher current densities may result in coarser or less dense zinc deposits in sulphate-based systems. The chloride bath produced a moderate coating thickness (2.91–7.28 µm) and a stable microhardness of 48.1 Hv, indicating a good balance between deposition rates and coating quality. Overall, the acetate bath showed the greatest potential for producing thicker coatings, while microhardness was highly dependent on the specific combination of pH, current density, and bath composition [15]. The higher Hv in acetate deposits (with larger D) is caused by internal stress, texture, or minor impurities rather than grain size alone, even though smaller grains typically increase hardness. Acetate still provides greater hardness under similar circumstances [9], [15], [21].
3.3.2. X-ray diffraction patterns
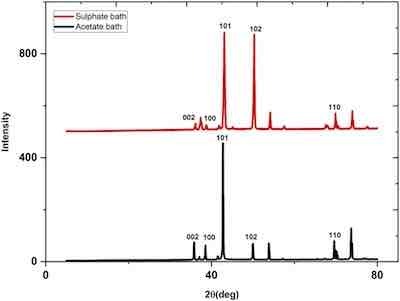 Fig. 5. The XRD patterns for zinc deposited from sulphate bath at 25 oC (pH = 4.72, I = 0.95 A/dm2, time = 10 min, 120 g/L ZnSO4+ 60 g/L Na2SO4) and for zinc acetate bath (100 g/L Zn (CH3COO)2. 2H2O, 75 g/L CH3COONa.3H2O, time = 15 min, I = 1.9 A/dm2, pH = 6.32).Fig. 5 shows XRD diffractograms of zinc deposits from the sulphate and acetate baths. The XRD patterns are characterized by the presence of preferred orientation of (101) and (102) for zinc deposited from the sulphate bath. The plane (102) is decreased significantly in the case of zinc deposited from a chloride bath.
The crystal sizes of the zinc coatings were calculated using Scherrer’s formula [20], [21], [24]:
D = Kλ/βcosθ (4)
where λ is the wavelength of the X-rays (0.154 nm for Cu Kα radiation) and θ is the Bragg diffraction angle. B is the full width at half-maximum height (FWHM) of the peak (in radians).
Data in Table 6 shows that the crystallite size of the zinc coating from the sulphate bath was significantly smaller (24.17 nm) than that from the acetate bath (42.05 nm), which resulted in noticeably higher hardness of the acetate bath. Crystallite size is an important variable affecting the hardness value [9], [15]. In fact, a smaller crystallite size implies a greater number of grain boundaries that impede dislocation motion and then create harder materials [22].
3.3.3. Surface morphology
The surface morphology of the zinc deposits on copper was analyzed using a scanning electron microscope. The zinc deposited from the acetate bath contains faceted, angular crystal structures. The crystals are mostly plate-like or lamellar, with well-defined hexagonal shapes, typical of zinc's hexagonal close-packed (HCP) structure (Fig. 6a) [22]. Some crystals exhibit terraced or stepped growth patterns, indicating layer-by-layer growth on specific facets (Fig. 6a).
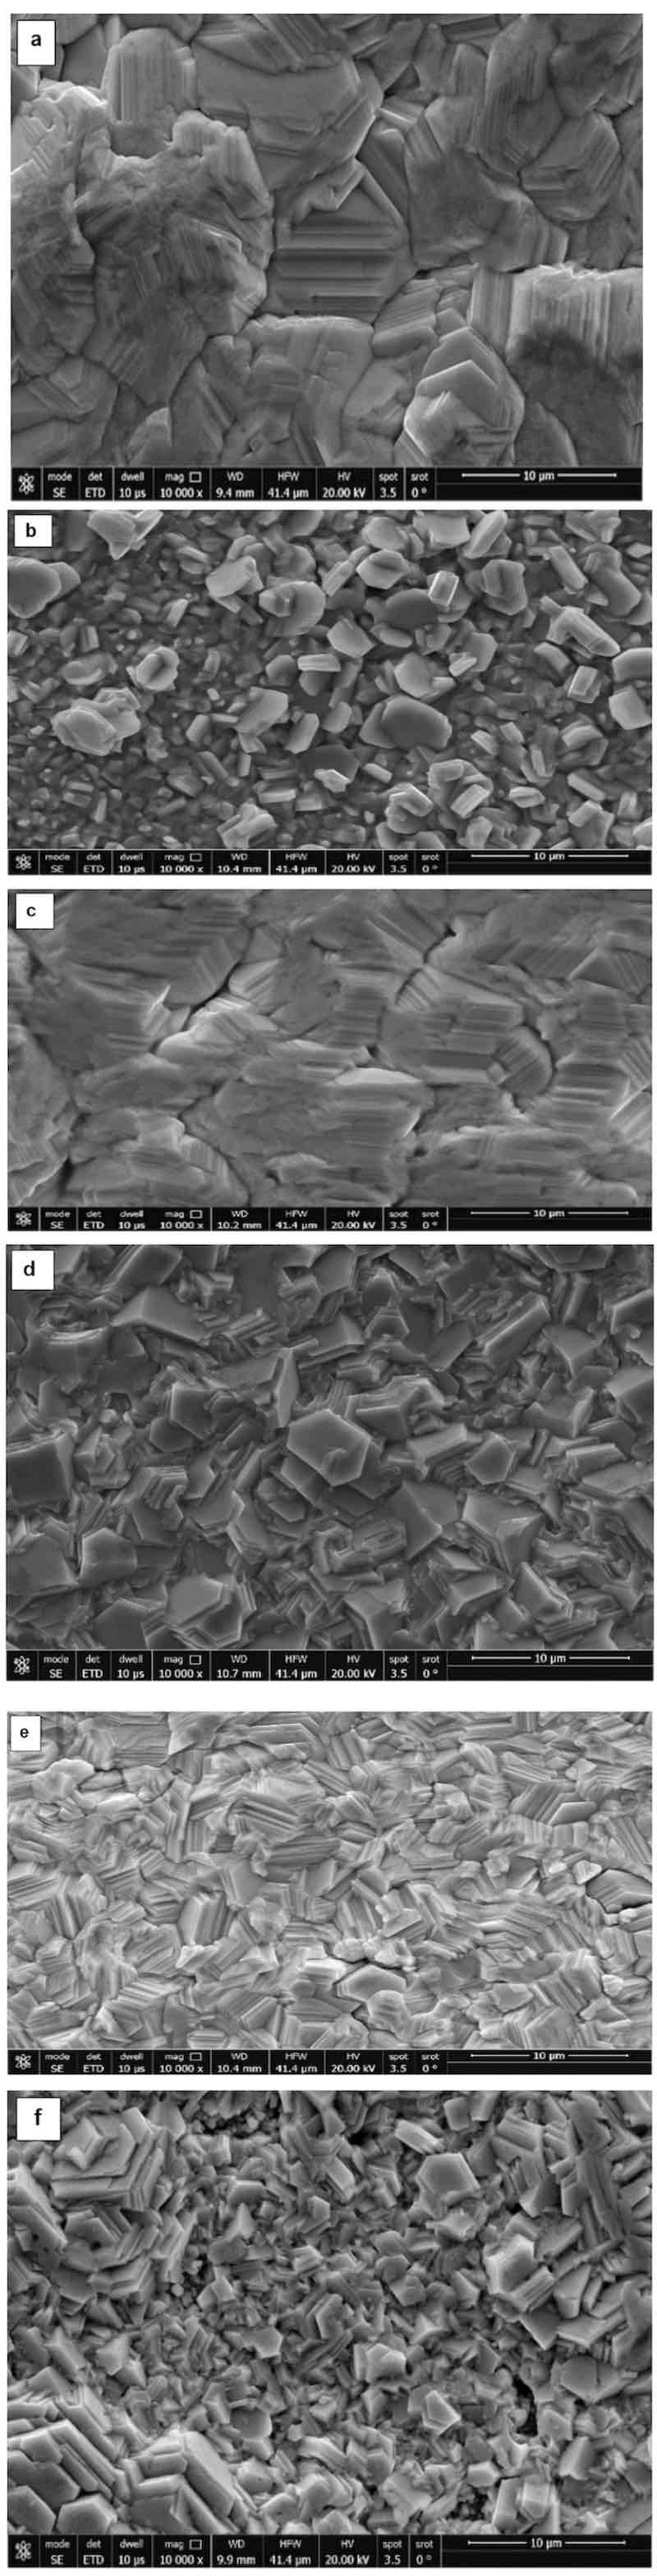
Fig. 6. (a, b): The photomicrographs of zinc deposited (at 25 °C) from different baths and operating conditions: a) 150 g/L Zn (CH3COO)2. 2H2O, 75 g/L (CH3COONa).3H2O, time 15 min, I = 1.9 A/dm2, pH 4.15; b) 100 g/L Zn (CH3COO)2. 2H2O, 75 g/L CH3COONa.3H2O, time 15 min, I = 1.9 A/dm2, pH 6.32. Fig. 6c: The photomicrographs of zinc deposited (at 25 °C): 150 g/L Zn (CH3COO)2.2H2O, 75 g/L CH3COONa.3H2O, time 15 min, I = 1.4 A/dm2, pH 6.32. Fig. 6d, e: The photomicrographs of zinc deposited (at 25 °C): d) 90 g/L ZnSO4.7H2O + 60 g/L Na2SO4, I = 0.95 A/dm2, time 10 min, pH 4.72; e) 120 g/L ZnSO4.7H2O + 60 g/L Na2SO4, I = 0.95 A/dm2, time 10 min, pH 4.72.Fig. 6f: The photomicrographs of zinc deposited (at 25 °C): f) 120 g/L ZnSO4.7H2O, 60 g/L Na2SO4, I = 0.48 A/dm2, time= 10 min, pH 4.72.
However, decreasing the zinc acetate concentration (Fig. 6b) reveals discrete, well-defined zinc crystals with faceted, angular shapes. Most particles are equiaxed (having similar length and width), with some exhibiting a slightly elongated prismatic or columnar form. The crystals appear as individual grains, rather than a continuous film. The grains are smaller and more numerous than in the first image, with sizes roughly in the range of 0.5–5 µm. However, in the case of deposition from the sulphate bath (Fig. 6d), images exhibit a platelet-like or lamellar morphology, similar to what is often observed with hexagonal close-packed zinc. The individual crystals are thin and flat, with mostly hexagonal or irregular polygonal outlines [7], [9], [15], [21].
Decreasing the zinc acetate concentration from 150 g/L (Fig. 6a) to 100 g/L (Fig. 6b) changes the crystal shape of the zinc deposit from hexagonal, large grains with a condensed structure to grains of different sizes, a mix between rectangular and hexagonal shapes. However, Fig. 6c shows a decrease in the current density from 1.9 to 1.4 A/dm2; the grain size does not significantly change, but becomes more compact. Typical hexagonal morphology for zinc deposits was obtained from the sulphate bath, Fig. 6d, e. The decrease in the current density has no significant change in morphology, Fig. 6e and f [7], [9], [15], [21], [25].
4. Conclusion
This comparative study of zinc electroplating baths revealed that electrolyte composition, current density, and pH have a significant impact on throwing power (TP) and overall deposit uniformity.
Among the three systems tested (chloride, sulphate, and acetate), the zinc chloride bath consistently had the highest (14.28–60.0) and TI (1.33–4.0) values across all parameters. Its superior performance is primarily due to improved cathodic polarization and high ionic conductivity, which allow for more uniform current distribution and efficient zinc ion transport, even in recessed substrate regions. The sulphate bath had moderate TP (5.26 – 33.33) and TI (1.0–2.32) performance and was very sensitive to changes in pH and current density. While it may be appropriate for controlled applications, its limited process stability makes it unsuitable for general industrial use. The acetate bath, while safer and more chemically stable, consistently produced the lowest TP (5.26–14.28) and TI (1.0–1.66) values, making it unsuitable for applications requiring high uniformity. Electrochemical analysis revealed that baths with higher polarization produced better TP due to improved secondary current distribution. Surface characterization confirmed that deposition conditions affect grain morphology, crystallite size, microhardness, and coating thickness. Smaller crystallite sizes correlated with higher hardness, whereas the acetate bath produced the thickest but softest coatings. Overall, the zinc chloride system is the most effective at producing uniform and high-quality coatings, particularly for parts with complex geometries. This study provides a solid framework for selecting and optimizing zinc electroplating baths based on application-specific criteria, as well as valuable insights into the design of advanced electrochemical deposition systems.
To further improve throwing power and coating uniformity, future research should investigate alternative, environmentally friendly electrolytes and additive systems.
Ajayb Saud Alresheedi and Manal El Sayed are with the Department of Chemistry, College of Science, Qassim University, Saudi Arabia.
CRediT authorship contribution statement: Manal Elsayed Sayed Manal: Writing – review & editing, Writing – original draft, Visualization, Validation, Supervision, Software, Resources, Project administration, Methodology, Investigation, Funding acquisition, Formal analysis, Data curation, Conceptualization. Ajayb Saud Alresheedi: Writing – review & editing, Writing – original draft, Visualization, Supervision, Software, Resources, Project administration, Methodology, Investigation, Funding acquisition, Formal analysis, Data curation, Conceptualization.
Declaration of Competing Interest: The authors Ajayb Saud Alresheedi, Manal El Sayed declare that no competing of interests on publication of the manuscript entitled (Evaluation and Comparison of Throwing Power in Various Zinc Electroplating Baths).
Acknowledgements: The Researchers would like to thank the Deanship of Graduate Studies and Scientific Research at Qassim University for financial support (QU-APC-2025).
References
[1] K. Kordesh, M. Weissenbacher, Rechargeable alkaline manganese dioxide/zinc batteries, J. Power Sources 51 (1–2) (1994) 61–78, https://doi.org/10.1016/0378- 7753(94)01955-X.
[2] H. Liu, S. Szunerits, Wenguo Xu, R. Boukherroub, Preparation of superhydrophobic coatings on zinc as effective corrosion barriers, ACS Appl. Mater. Interfaces 1 (6) (2009) 1150–1153. https://pubs.acs.org/doi/10.1021/am900100q.
[3] S. Müller, F. Holzer, O. Haas, O. Optimized zinc electrode for the rechargeable zinc–air battery, J. Appl. Electrochem. 28 (9) (1998) 895–898, https://doi.org/ 10.1023/A:1003464011815.
[4] B. Hubert, Y. Nikodimos, B.J. Hwang, J.P. Chu, Ag-coated 3D groove as a study platform in evaluating the throwing power of electrolytes for Li metal batteries, J. Power Sources 589 (2024) 233660, https://doi.org/10.1016/j.jpowsour.2023.233660.
[5] C. Sun, J. Dong, X. Lu, Y. Li, C. Lai, Sol electrolyte: pathway to long-term stable lithium metal anode, Adv. Funct. Mater. 31 (26) (2021) 2100594, https://doi.org/ 10.1002/adfm.202100594.
[6] M.A.M. Ibrahim, Zinc coatings on steel from complexing alkaline ammoniacal baths by electrodeposition, J. Appl. Surf. Finish 3 (2) (2008) 89–98.
[7] A. Suzuki, S. Oue, H. Nakano, Synergistic effects of additives on the deposition behavior, throwing power, and surface roughness of copper obtained from electrorefining solutions, Mater. Trans. (5) (2020) 972–979, https://doi.org/ 10.2320/matertrans.M-M2020808.
[8] X.F. Wei, Q.S. Zhu, J.D. Guo, J.K. Shang, Obtaining ultra-high throwing power in Cu electroplating of flexible printed circuit by fast consumption of a suppressor, J. Solid State Electrochem. 26 (1) (2022) 171–181, https://doi.org/10.1007/ s10008-021-05055-0.
[9] J. Huang, N. Song, M. Chen, Y. Tang, X. Fan, Electrodeposition, microstructure, and characterization of high-strength, low-roughness copper foils with polyethylene glycol additives, RSC Adv. 14 (51) (2024) 38268–38278, https://doi.org/10.1039/D4RA06688J.
[10] M.A.M. Ibrahim, E.M.A. Omar, Synergistic effect of ninhydrin and iodide ions during electrodeposition of zinc at steel electrode, Surf. Coat. Technol. 226 (2013) 7–16, https://doi.org/10.1016/j.surfcoat.2013.03.026.
[11] M.A.M. Ibrahim, Improving the throwing power of acidic zinc sulfate electroplating baths, J. Chem. Technol. Biotechnol. 75 (2000) 745–755, https:// doi.org/10.1002/1097-4660(200008)75:8%3C745::AID-JCTB274%3E3.0.CO;2-5.
[12] S.B. Jeon, B.K. Son, J.W. Choi, I. Son, Effects of organic additives on alkaline non- cyanide zinc electroplating, Coatings 13 (2023) 78, https://doi.org/10.3390/ coatings13040781.
[13] A.J. Mohammed, M. Moats, Effects of carrier, leveller, and booster concentrations on zinc plating from alkaline zincate baths, Metals 12 (2022) 621, https://doi.org/ 10.3390/met12040621.
[14] A.D. Abdel Salam, H.H. Hassan, B.A. Elsayed, M.A.M. Ibrahim, The catalytic role of L-cysteine during electrolytic zinc deposition, Egypt. J. Chem. 67 (6) (2024) 239–246, https://doi.org/10.21608/ejchem.2023.242373.8762.
[15] M.A.M. Ibrahim, R.S. Bakdash, Zinc coatings of high hardness on steel by electrodeposition from glutamate complex baths, Trans. IMF 92 (2014) 218, https://doi.org/10.1179/0020296714Z.000000000184. 8 A.S. Alresheedi and M. El Sayed
[16] M.A.M. Ibrahim, R.S. Bakdash, New non-cyanide acidic copper electroplating bath based on glutamate complexing agent, Surf. Coat. Technol. 282 (2015) 139–148, https://doi.org/10.1016/j.surfcoat.2015.10.024.
[17] J. Khakzadian, S.H. Hosseini, K.Z. Madar, Catalytic effect of L-proline on the reduction of Ni (II) ions during nickel electrodeposition from a Watts-type nickel bath, Surf. Coat. Technol. 347 (2018) 113–122, https://doi.org/10.1016/j.surfcoat.2018.04.079.
[18] S. Field, Quantitative throwing power, in: Met. Ind., 44, Taylor and Francis, London, 1934, pp. 614–617.
[19] P.N.S. Casciano, R.L. Benevides, R.A.C. Santana, A.N. Correia, P. de Lima-Neto, Factorial design in the electrodeposition of Co Mo coatings and their evaluations for hydrogen evolution reaction, J. Alloy. Compd. 723 (2017) 164–171, https:// doi.org/10.1016/j.jallcom.2017.06.282.
[20] D.L. Bish, J.E. Post. Modern Powder Diffraction, The Mineralogical Society of America, Washington, Los Alamos, New Mexico, USA, 1989, p. 204. International Journal of Electrochemical Science 21 (2026) 101260 [21] K. Raeissi, A. Saatchi, M.A. Golozar, J.A. Szpunar, Texture and surface morphology in zinc electrodeposits, J. Appl. Electrochem. 34 (2004) 1249–1258, https://doi.org/10.1007/s10800-004-1699-8.
[22] R.M. Krishnan, C.J. Kennedy, S. Jayakrishnan, S. Sriveeraraghavan, S.R. Natarajan, C. Ramamurthy, R. Anantharam, Zinc electrodeposition from acetate solutions, Met. Finish. 94 (10) (1996) 43–46.
[23] E. Raub, K. Müller, Fundamentals of Metal Deposition, New York, 1967, Ch. 6, p. 198.
[24] A.Y. Lee, D. Erdemir, A.S. Myerson, Crystals and crystal growth, Handb. Ind. Cryst. 3 (2019) 32–75.
[25] A. Gomes, M.I. da Silva Pereira, Pulsed electrodeposition of Zn in the presence of surfactants, Electrochim. Acta 51 (2006) 1342–1350, https://doi.org/10.1016/j.electacta.2005.06.023.