


This paper describes one successful example of a capstone senior design research project that deals with optimization of the electrostatic powder coat cure process.
Optimizing any manufacturing process provides a company with extensive benefits obtained through increased productivity, reduced manufacturing costs, and quicker time to market. Along with the explicit production cost benefits, a company will also reap the benefits of a decreased environmental impact and increased market competitiveness accruing from increased productivity. Therefore, companies are incentivized to continually improve, and optimize their production processes.
One such process that many products, throughout numerous industries, go through is the painting process. While painting a product can aid in easily identifying certain brands (e.g. John Deere green, Caterpillar yellow, New Holland blue, International Harvester red, etc.), the main purpose of providing a painted surface is to protect the product from environmental corrosion, and wear in addition to providing a drastically longer life cycle to the product. One of the most important steps of the painting process is the curing of the paint on the surface of the product. This is normally done through an industrial oven set at appropriate temperatures and times depending on the paints used and the products to be painted.
Using DOE, ANOVA, and other statistical analysis tools for data collection and analysis, a cure oven set at 450 F for 40 minutes was optimized to 450 F for 38 minutes. This provides a 5% decrease in both process time and natural gas usage while continuing to maintain the same level of quality. This demonstrates the effectiveness of DOE tools and statistical analysis of collected data coupled with the principles of process optimization in increasing productivity and reducing overall production costs.
Original title: Optimization of electrostatic powder coat cure oven process: A capstone senior design research project
1. Introduction
A review of literature shows that the Industrial Revolution was a period during which predominantly agricultural, rural societies in Europe and America became industrial and urban [1]. Prior to the Industrial Revolution manufacturing was done with hand tools or basic machines, often in people’s homes. With industrialization manufacturing shifted to power tools, automated machinery, and mass production in factories [2-3].
The first industrial revolution started with the arrival of steam power in Britain’s factories, and mechanization of manufacturing in the 18th century. The second industrial revolution started in the US with electronic equipment, power plants, and mass production assembly lines in meat processing, car manufacturing, earth moving equipment, and ship building industries. The third industrial revolution started in the 1970’s with the arrival of IT into the factory, followed by mobile communications, social media, and big data, which are called the Internet of Things (IoT) that have already happened [4]. The fourth industrial revolution, Industry 4.0 is an evolution in manufacturing, incorporating advanced communications, and automation that started in 2013 in Germany [5-6]. In which, factories will become increasingly automated with large-scale M2M and Internet of Things (IoT) deployments, and machines within the factory will not only reach new levels of self-monitoring, and self-diagnosing, but also have the ability to analyse and communicate with each other and their human co-workers to provide a truly productive future. This Industrial Internet of Things (IIoT) will create incessant waves of new technology and intense global competition that will demand highly educated workers, who can create and apply sophisticated new technologies [7].
In order to compete with other nations in such an environment, it becomes incumbent on US to not only invest in new and emerging technologies but also in training and development of its workforce with skills in STEM areas, otherwise the US will risk sliding down the pecking order [8]. To meet this national demand, US universities have focused their energies toward producing graduates, who are well prepared to enter the American workforce. To fulfil this goal, Bradley University offers undergraduate Industrial and Manufacturing engineering and Technology (IMET) programs accredited by the Accreditation Board for Engineering and Technology (ABET). The hall mark of this engineering program, and in fulfillment of the requirements of ABET for reaccreditation, value sensitive education is offered to its graduates, who address real life problems from the local area they serve. The overall goal of the program is not only to improve manufacturing education to better meet current and future needs of the industry, but also use innovative methods for manufacturing education that meets the national need to develop manufacturing workforce that can hit the ground running as they enter the industrial workforce [9-16].
The IME Capstone Senior Design Course provides a culminating experience in application of earlier course work in problem solving and addressing real world industrial problems. It is an “epitome” of goal engineering, in which the goal is to immerse in a total activity for defining solutions to a) problems not solved before, or b) problems that have previously been solved in a different way, by defining new solutions through application of scientific principles and utilization of intellectual ability to ensure the product, or process, or methodology satisfies an agreed market need and product design specification. In addition, the project will permit manufacture by the optimum method, in which the completion of the capstone activity is characterized by the resulting product, or process, or methodology, or software provides an acceptable level of performance. Alternatively, it truly serves as a "bridge" between academic course work and the first job after graduation. The details of one such Capstone Senior Design experience is described in the rest of this manuscript that not only resulted in successful implementation of project findings but also gainful employment of the student after graduation.
The painting of industrial products has been a standard throughout the manufacturing sector for the past century. Painting a product with a quality finish can provide a phenomenal marketing platform, as many companies are known worldwide for being a specific color, depending on the industry. For example, John Deere agricultural implements are painted a specific shade of green, Caterpillar products have their own shade of yellow, and International Harvester agricultural implements (now Case IH) are painted red and black. However, the general usage of paint on any industrial product is to protect the base material from external adverse effects of the environment and to provide an aesthetic look, feel, and texture to the exposed surface of products [17]. Any product that is composed of raw steel is at additional risk of corrosion, rusting, deterioration, and ultimately loss of strength and functionality, if exposed to the various weather conditions [18]. It is mainly for protecting the product from external elements, providing a pleasing look, and branding their product with a specific color, that manufacturing companies provide a product with a painted surface [19]
The experimental work for the following research project was performed at a facility that produces agricultural implements, specifically tillage equipment. An example of this type of tillage equipment is shown below in Figure 1. The facility produces several products that range in function and production requirements. Due to this, there is high variability in product size, complexity, shape, orientation, and density. An example of this phenomenon is as follows: a claw shaped implement used to break apart compacted soil that has fewer than eight components welded together and is roughly 20 lb in weight, versus a 1000 lb frame that is used to support all objects actively interacting with the soil being prepared and consists of more than 20 different component parts welded together. However, the one key similarity amongst all products was that they were all made from low carbon steel, lending almost identical property characteristics to all the test samples used in this research. All these variations are addressed in Bradley University’s capstone senior design research project that is described in this manuscript.

Figure 1: Cultivator implement being utilized in the field
2. Project Development
To be successful in any project, the first thing that must be completed is proper development of the project. Fully describing the current problem, understanding the processes, scope, and risks, and understanding how to address the risk, are all essential to setting up a project to be successful. The first item developed in this practice is the project charter, shown below in Figure 2. This gives a general description of why the project was chosen from a business standpoint, the opportunity that exists in this project, description of project goals and the anticipated gain from this project, what is within and beyond the scope of the current project, as well as potential deadlines and who is responsible for the project. This methodology was the governing principles and general guideline that was followed throughout the project.
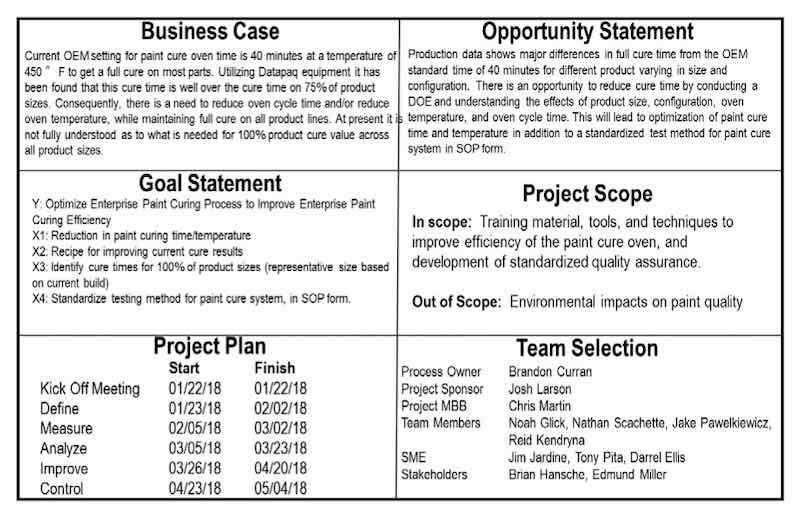
Figure 2: Project Charter.
Once the project charter was developed, the Voice of Customer (VOC), Voice of Business (VOB), and Critical Customer Requirements (CCR’s) were developed. These can be seen below in Figure 3. The VOC is used to lay out what desires the customer has from the business, regarding the current project. The VOB is used to lay out what the business desires from the completion of the project, and what are the overarching objectives to improve the business. Together the VOC and VOB are used to develop the CCR’s. The CCR’s lays out 4 key components P, Q, V, C that pertains to safety of the People, product Quality, Velocity of the process, and Cost. Together PQVC creates a target for the project to aim for.
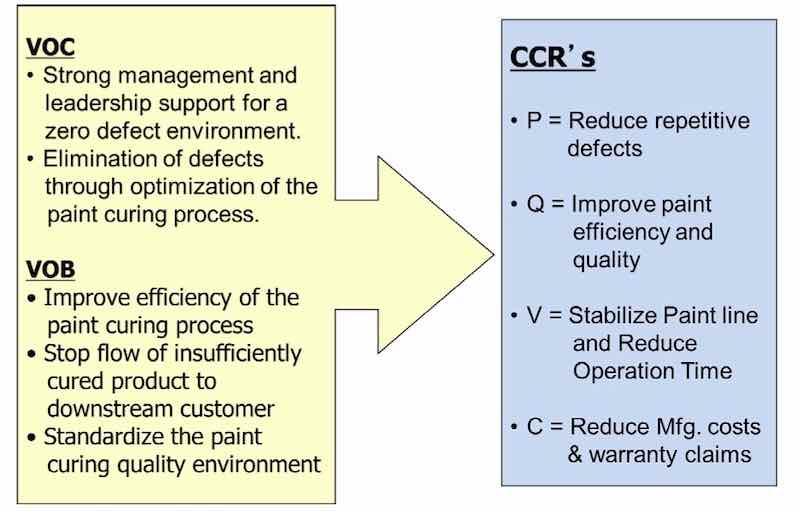
Figure 3. VOC, VOB, and CCR
The next component of project definition that was developed is the SIPOC process map. As can be seen in Figure 4, the SIPOC stands for Suppliers, Inputs, Process, Outputs, and Customers. This map is used to lay out the factors of possible influence on the front and back end of the process that is being analyzed. The front end consists of the suppliers and the inputs. This is what determines the parameters that are used for this specific process. On the back end of the process are the outputs and customers. This is what determines the goals and objectives desired for the process to produce. For all these items, the variables that have been determined to be imperative, or have the largest influence, have been highlighted to indicate importance. The last item of information that is provided from the SIPOC are the Start and End boundaries of the process being analyzed, shown at the top of the figure.
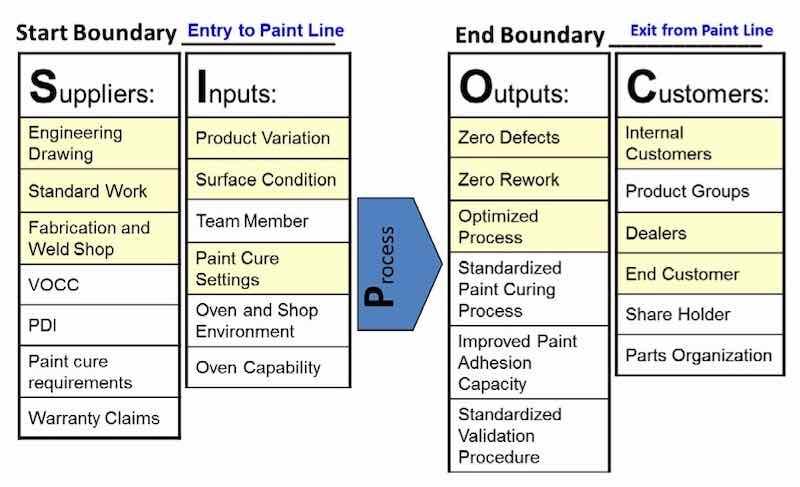
Figure 4: SIPOC Process Map
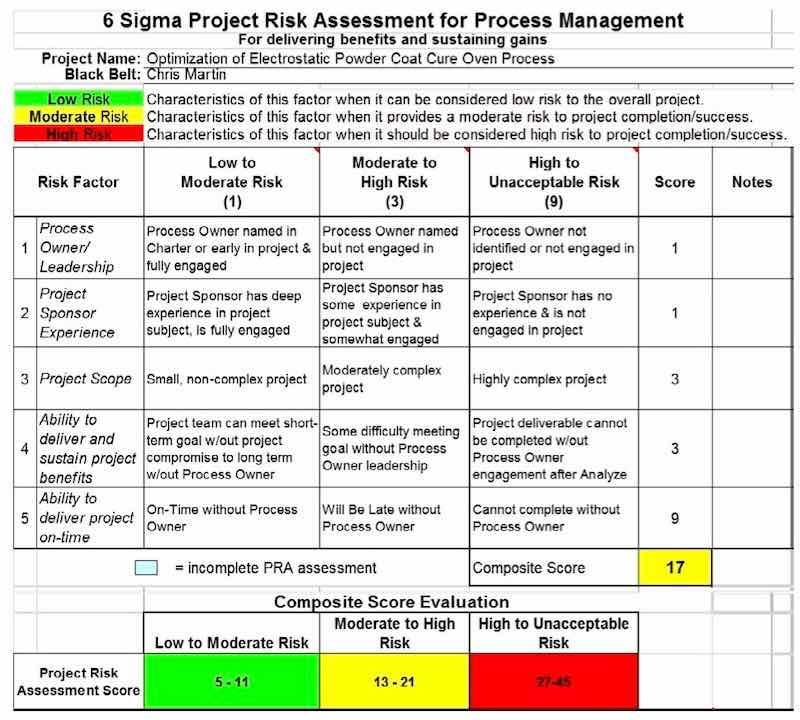
After the SIPOC process map has been developed, the project risks must be assessed and analyzed. The first item developed to accomplish this is the Project Risk Assessment matrix, shown below in Table 1. This table lays out the general risk of the project based on 5 factors: process owner/leadership, project sponsor experience, project scope, ability to deliver and sustain project benefits, and the ability to deliver project on-time. These factors are given a score of either 1, 3, or 9 based on the individual risks of these factors. The individual scores for each factor are then added to obtain the project’s overall risk score. This provides understanding as to whether the project is low risk, moderate risk, or high risk, and can help lay out the necessary resources accordingly.
Table 1: Project Risk Assessment
In conjunction with the Project Risk Assessment comes the Business Risk Management (BRM) risk identification. Risks anticipated in Define phase are shown in Table 2. To create the Risk Identification table, the team brainstorms specific possible risks in the DMAIC phases of the project. These risks are then identified as to what area that risk pertains to, as well as the significance and likelihood of that risk occurring. Once these risks have been identified and scored accordingly, they are plotted onto the Risk Map, shown in Figure 5. This provides a general idea of the significance and likelihood of project risks. Once all the items for defining the project were completed, the team could start with the experimental techniques of the project.
Table 2: BRM Risk Identification
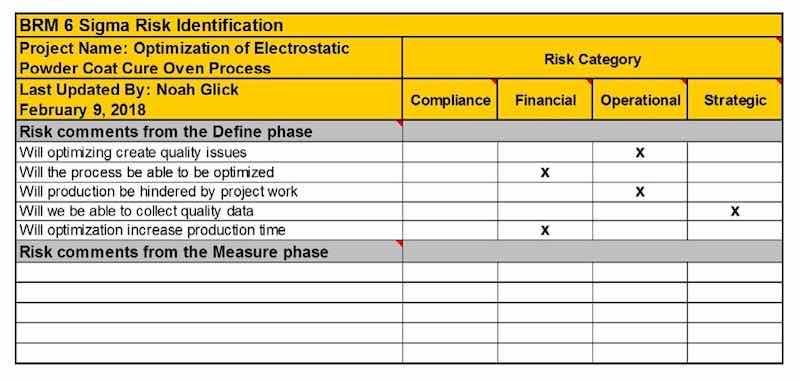
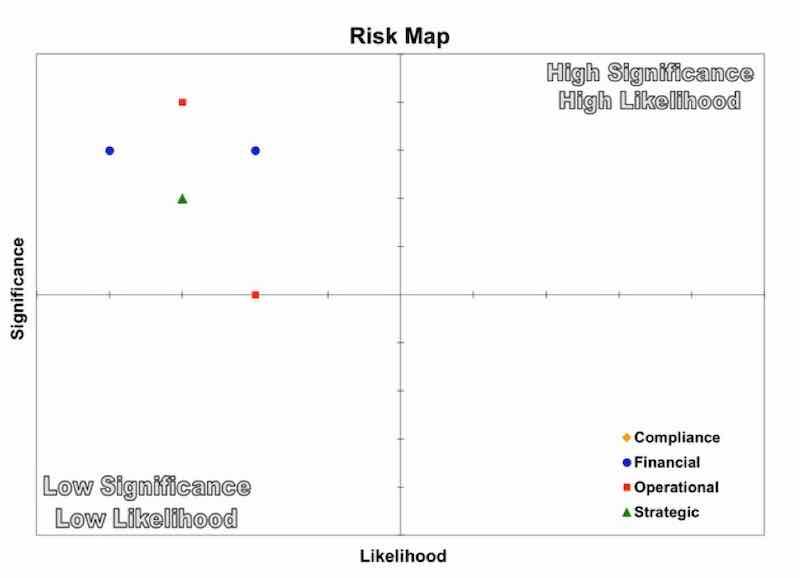
Figure 5: BRM Risk Map
3. Experimental Techniques
3.1 Process introduction
The experimental study in this research was focused on the painting process of various component parts used in developing the agricultural implement products. The paint line used eight distinct processes: Loading, cleaning, conversion coating, drying, paint coating, curing, cooling, and unloading. As an example, a general process flow diagram is shown in Figure 6. After the loading station, the first two processes deal with the preparation of the surfaces to be painted. The cleaning process involved usage of a steel ball shot blast bay in which steel balls roughly 1 mm in diameter were propelled by tangential force at roughly 500 feet per second into the material to remove any impurities; such as dirt, grease, oil, oxidation, and other impurities that could be present on the surface of the product [20].
After shot blasting, conversion coating is used to create a layer of protection against elemental forces in between the paint and the raw material. The conversion coating consists of a liquid chemical compound that is sprayed onto the part. This chemical compound provides a layer of protection against the environment in the event the paint on the material is removed.
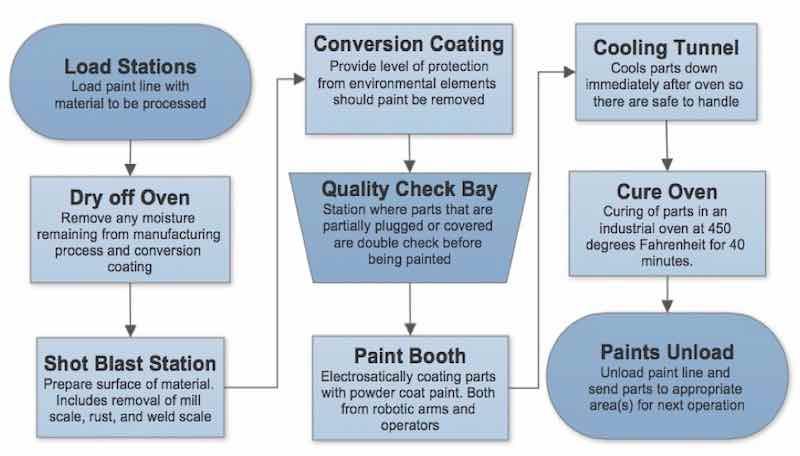
Figure 6: Paint Process Flow Diagram
Once the material has been prepped, the product then moves to a drying oven to eliminate any and all residual moisture that could be present in or on the product prior to coating with paint. To ensure that a quality coat of paint is applied and cured, the part must be free of any excess moisture, regardless of paint application methods used [21].
The drying process is not only used to dry the liquid used in the conversion coating process but also any water that may have found its way onto and/or into the product being processed. Some of the larger component parts can be stored outside for a short period of time, for numerous reasons, prior to being processed through the paint line. During these short periods of time, products can be subject to several forms of moisture, most frequent of which is rain. While the shot blast station addresses the issue of any contamination that may have accumulated onto the part, the drying station ensures that any excess moisture has been removed from the material prior to coating with paint.
Once the product has been dried completely, it undergoes the painting process. In all experiments electrostatic powder coat method of painting was used that involves grounding the product being painted, and electrostatically charging a powdered paint particulate that is blown by air through a nozzle onto the product [22, 23]. There are several advantages to electrostatic powder coating that include, but are not limited to the following: improved product coverage, reduced paint usage, ability to reclaim and reuse unused material, and a more uniform layer of paint [24, 25].
The final steps in the painting process involve curing the powder coat on the product, and then cooling the product before unloading and moving the product further down the production line. The curing process for powder coat requires that the product be subjected to intense, concentrated heat to temporarily liquefy the powder, followed by long term, ambient heat for a set time and temperature based on the requirements for the paint being used [26]. This provides several aspects to the paint. The first is that due to the initial intense heat, the surface of the paint has a high gloss, uniform finish that has a high marketability [27]. The second is that due to the secondary, long cure process the paint gets adhered to the metal surface of the product, and the surface of the paint gets hardened to a level that will retain its structure while being used in the field. In essence paint curing provides strong adhesion, strength, and luster to the paint [28].
This final cure process was the area of concentration in this research project. The cure oven used in the facility is set at a temperature of 450 degrees F, and parts are processed for 40 minutes. The cure oven with parts passing through it is shown below in Figure 7, and a thermal map showing some of the hot spots in the oven is shown in Figure 8. The goal of the experiment was to optimize the curing process to eliminate waste in the curing process. The method for optimizing the cure oven utilized extensive data collection along with statistical analysis of the data to be able to find the optimal settings for the cure oven.
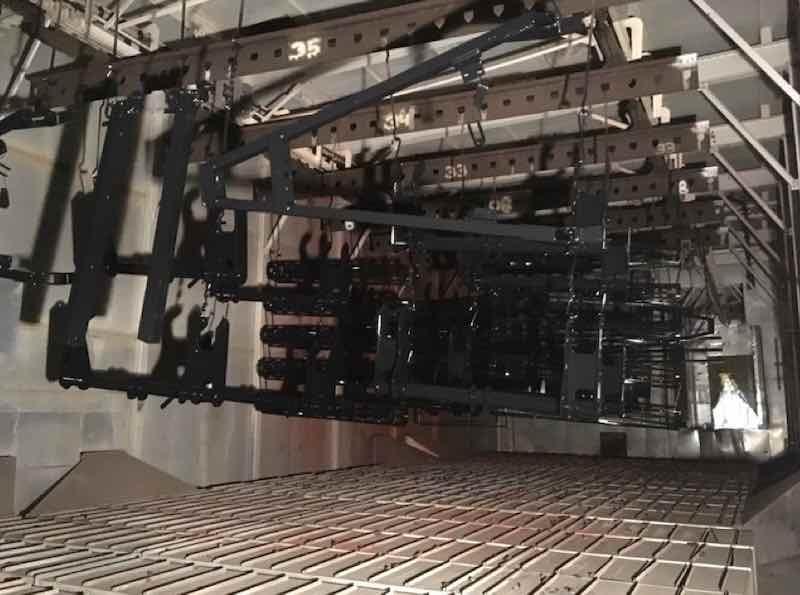
Figure 7: Cure Oven
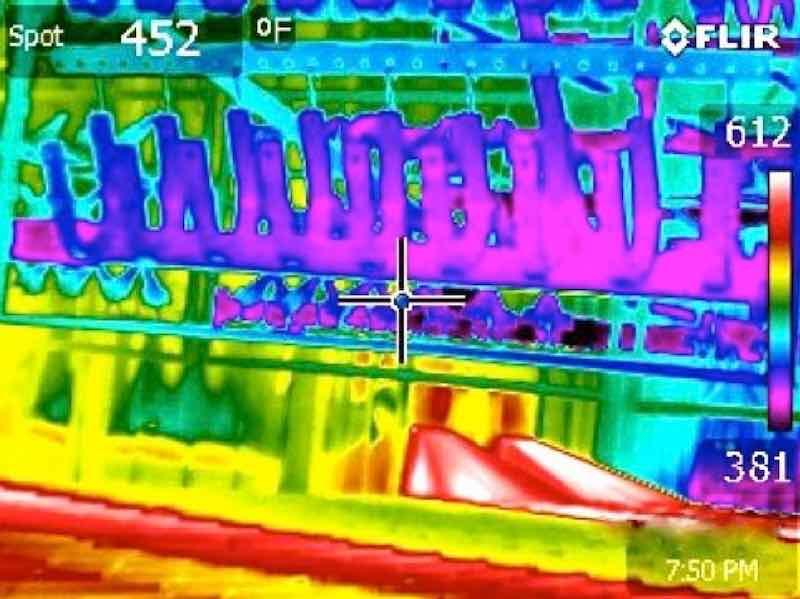
Figure 8: Thermal Map of Cure Oven
To achieve the goal of optimizing electrostatic powder coat oven cure process, and to obtain maximum amount of information with minimum number of experiments, time, and resources, a well designed experimental plan was a necessary pre-requisite. As such, a well thought out experimental plan with four distinct categories was used: data acquisition, sample preparation, design of experiments, and test procedure.
3.2 Data acquisition
All data collected throughout the experiment to seek optimization was done with the use of the Datapaq EasyTrack 3 (Datapaq) thermal profiling system from Fluke Process Instruments. The Datapaq consists of the following: five thermocouples and a air probe connected to data logger, a data logger to record all temperature readings, and an insulated capsule to protect the data logger from excessive heat and cold. The Datapaq hardware is shown below in Figure 9. This is the equipment that travels through the oven with the part(s) being analyzed. Shown in the picture is the data logger with all probes inserted for measurement, as well as the insulation capsule.
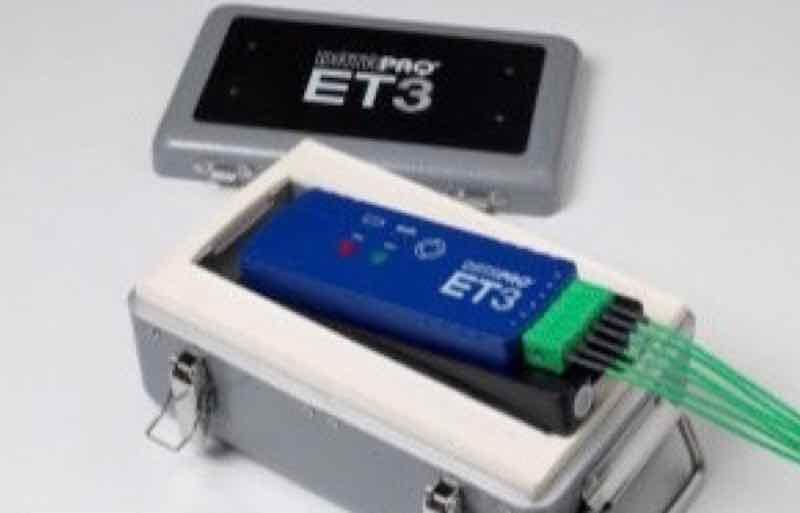
Figure 9: Datapaq EasyTrack 3
Accompanying the Datapaq hardware is the software, where all data collected is downloaded for later analysis. The recorded data includes: raw temperature readings at the desired time intervals (5 Hz frequency was chosen for this experiment) for all sensors, time spent above the temperatures of 300 F, 325 F, 350 F, and a dimensionless number designated as the Datapaq Value. This datapaq value is a dimensionless number, obtained from Datapaq Software, that represents whether the paint has cured or not. For purposes of this experiment, datapaq values greater than 150 represented a full cure, and values below 150 represented paint that was not fully cured. The specific powder coat paint being analyzed was cured properly when the substrate temperature was above 300 F for 25 minutes, above 325 F for 15 minutes, and above 350 F for 8 minutes, or any combination of the 3 temperature ranges. It is important to note that probes could not be attached to a part that had been coated in powered paint, as the probe would be permanently attached once the paint cured, hence the need for the datapaq value as a representative value of cure.
Before embarking on the actual experimentation, preliminary tests were conducted to develop a better understanding of the factors that influence Datapaq value. Raw data from tests run prior to the experiment was taken and analyzed through regression analysis to determine what factors and process parameters determine the Datapaq value. From the entire data set, all temperatures greater than or equal to 300 degrees F were separated and analyzed to see if there exists a correlation to the Datapaq value. Several different methods were tested, including simple linear, multiple linear, and data transformations of several forms. Through testing different combinations and factors, it was determined that a multiple linear regression with independent variables of maximum temperature reached, time above 300 degrees F, and the total sum of all recorded temperature resulted in the most accurate prediction of Datapaq value based on adjusted R2 value.
However, it was found that while this combination provided the most accurate description of how the Datapaq values were obtained, the resulting linear equation was not identical to ones obtained amongst separate data collection tests. This lead to the conclusion that there is an algorithm built into the Datapaq software that develops a unique relationship between the factors aforementioned and the Datapaq value based on the data collected. This information was used later in narrowing the scope of testing for the experiment.
3.3 Sample preparation and screening tests
In the industrial setting there are a myriad of factors that vary across parts going through the paint oven. Parts that are welded range in shape, size, thickness, complexity, and type of weld being used. All these factors could contribute to the success or failure of the paint cured on the product. Due to constraints in the availability of time and resources, a limited experimental plan was designed to focus on the most crucial aspects of product geometry on paint curing process.
The first process parameter examined was the material thickness. After examining all the parts going through the paint cure oven and their corresponding thicknesses, it was determined that the thicknesses of parts going through the paint oven could vary between ¼ inch to 2 ½ inches. Logically, the crucial thicknesses to be measured are the thicker sections of a part based on traditional understanding in the paint shop that, if the paint on the thicker section was cured then invariably the paint on the thinner sections was already cured. However, the lower end of part thickness that might be considered crucial for testing purposes was unknown. Therefore, a test was conducted on the lower range of part thickness to determine what range could be eliminated from the experimental plan. Parts with thicknesses of ¼ inch, ½ inch, and 1 inch were tested in the oven, and it was concluded that any part thickness below 1 inch could be eliminated from the experiment for all cure times. The effect of the material thickness variation on temperature reached in the part with respect to time is shown in Figure 10.
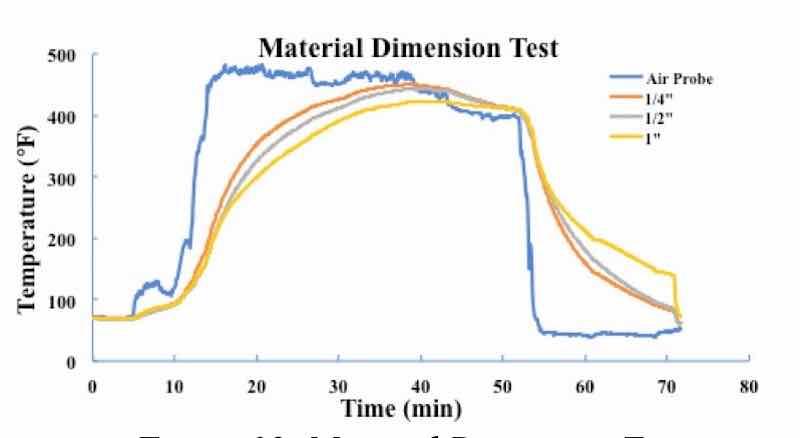
Figure 10: Material Dimension Test
It can be clearly seen from this figure that all three parts reached and maintained a temperature above 400 degrees F for 10 minutes or greater; well above the time and temperature requirements for a fully cured component.
The second process parameter examined was the type of weld. A large majority of parts that are painted and cured consist of welded components. The specification for Welding Earthmoving, Construction, and Agriculture Equipment AWS D14.3 was used in this facility. For all welding work done 0.045” diameter wire was used with the GMAW (MIG) welding process. These welded sections vary across the different number of parts as the product requirement varies. Parts that require maximum rigidity and strength are completely welded together with no gaps in-between the component parts, whereas parts that need more flexibility in their motion will require only a partial or skip weld to hold the components together. As this was a major factor in many of the parts, this difference had to be analyzed. To analyze this relationship, five test samples were designed and fabricated: 1 test plate of ¼ inch thick steel, 1 test plate of ¼ inch thick steel welded to another ¼ inch thick steel plate in a skip welded fashion, 1 test plate of ½ inch thick steel, 1 test plate of ½ inch thick steel plate welded to another ½ inch thick steel plate in a skip welded fashion, and 1 test plate of 1 inch thick steel. These five test plates were processed through the paint oven and the corresponding temperature data recorded. Next the two skip welded test plates of ¼ inch – ¼ inch and ½ inch – ½ inch were then fully welded together, closing off all gaps between the two pieces of steel. Then the five test plates were processed again through the paint oven to collect the 2nd set of temperature data to compare with the original data. These sets of data are shown in the graphs below in Figures 11 and 12. From these tests it was concluded that parts that were skip welded heated up at the same rate as their component thicknesses, whereas parts that were fully welded heated up slower than their component thicknesses.
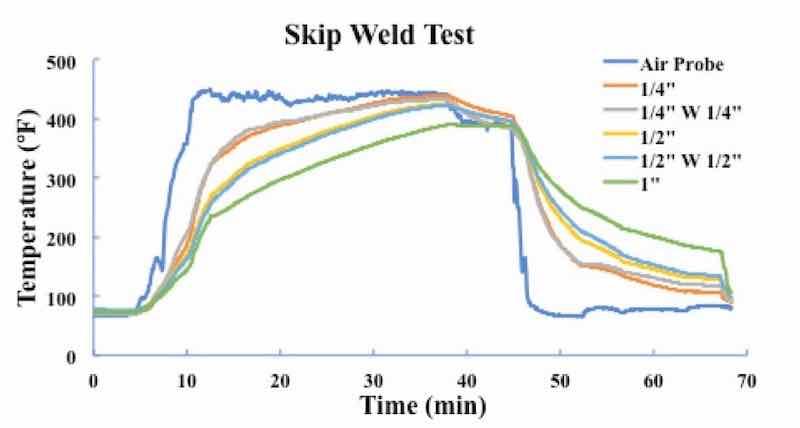
Figure 11: Skip Welding Test
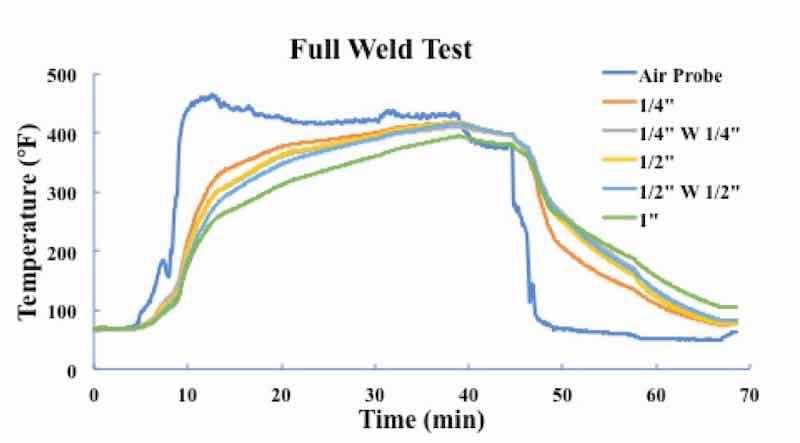
Figure 12: Full Welding Test
The third process parameter examined was components consisting of hollow tubes of various sizes. Depending on the product requirements, parts that have hollow tubes as a component may be either open or closed on the ends of the tubes. To determine the effect of this design characteristic on the curing of paint on various products, two tests were performed. For the first test two hollow tubes were processed through the paint oven, and data collected on the substrate temperature at various locations across the two tubes. After this a second test was performed in which both tubes were sealed off and processed through the paint oven again with probes in the same location to analyze the difference in paint curing on open and closed end hollow tubes. The results showed clearly that when the tubes are sealed off, they would heat up at a slower rate than when they are left open. Logically this makes sense, as the open tubes have a path of travel for hot air to pass on both sides of the steel tubing. In the case of tubes sealed on both ends, only the externally exposed areas of the tube gets heated up from furnace heating, and the inner surface of the tube gets heated up by conduction of heat from the outer surface, The air trapped inside the sealed tubing is at relatively low temperature than outside which extends the time taken to heat the inside and bring the entire part to the same temperature. These results are shown graphically below in Figure 13 and 14.
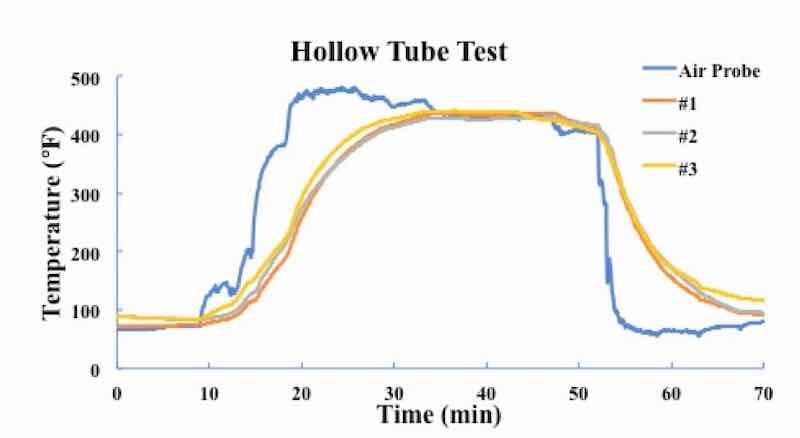
Figure 13: Hollow Tube
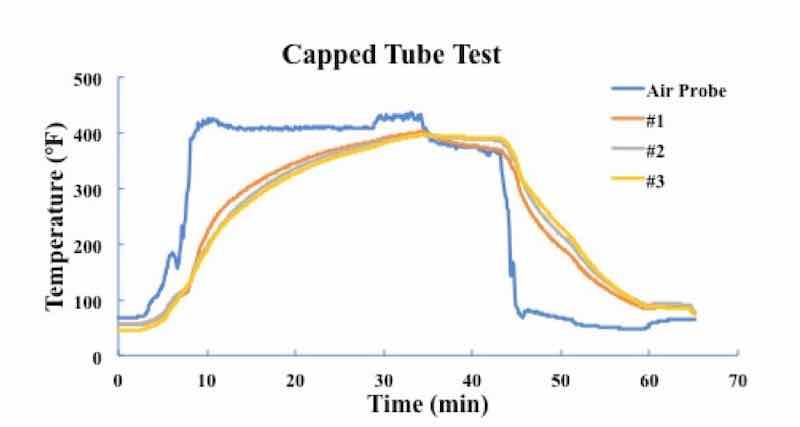
Figure 14: Capped Tube
The last process parameter examined was the vertical positioning of the product in the paint oven. When being processed in the oven, parts can, theoretically, be located anywhere within a roughly 12-foot vertical span. To determine what affect this had on the paint curing process of parts, a 10-foot bar was processed through the oven with the Datapaq. The probes were located at 2 ½ foot intervals along the height of the bar starting at the very top and ending at the very bottom. The results of this test are shown below in Figure 15. From this test it was observed that there was a 10 degree F difference in max temperature reached between the top and bottom of the bar, with roughly every foot increase vertically, a decrease of 1 degree F. However, given that parts are rarely, if ever, positioned along the extremes of this range, it was concluded that this discrepancy was negligible for the purposes of this experiment.
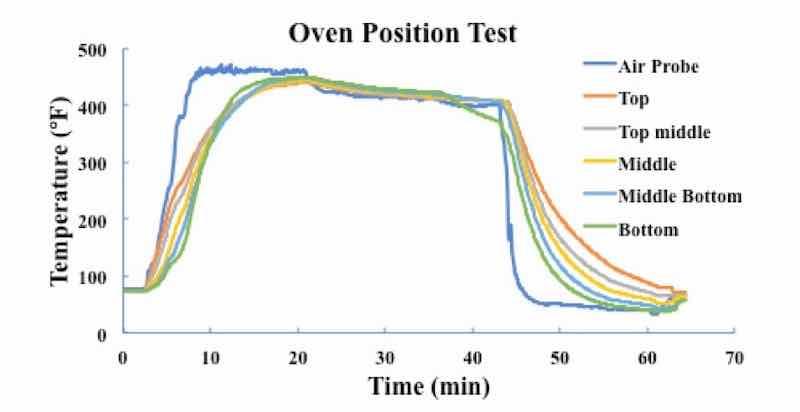
Figure 15: Oven Position Test
Once all the key process parameters were examined and the factors that could be eliminated were identified, test samples were developed based on the remaining factors. In total, five separate test pieces were made, each of a varying thickness. The thicknesses chosen for the experiment are as follows: 1-inch, 1 ½-inch, 2-inch, 2 ¼-inch, and 2 ½-inch. With exception to the 1-inch piece, all thicknesses are comprised of two or more plates welded together. The 2 ¼, and 2 ½-inch sections have the addition of capped tubes welded to the back to simulate product areas that were found to be of concern. This test piece configuration was used to simulate the real-world condition with higher accuracy. These test pieces were used repeatedly throughout the experiment to maintain consistency and are shown in the Figure 16.
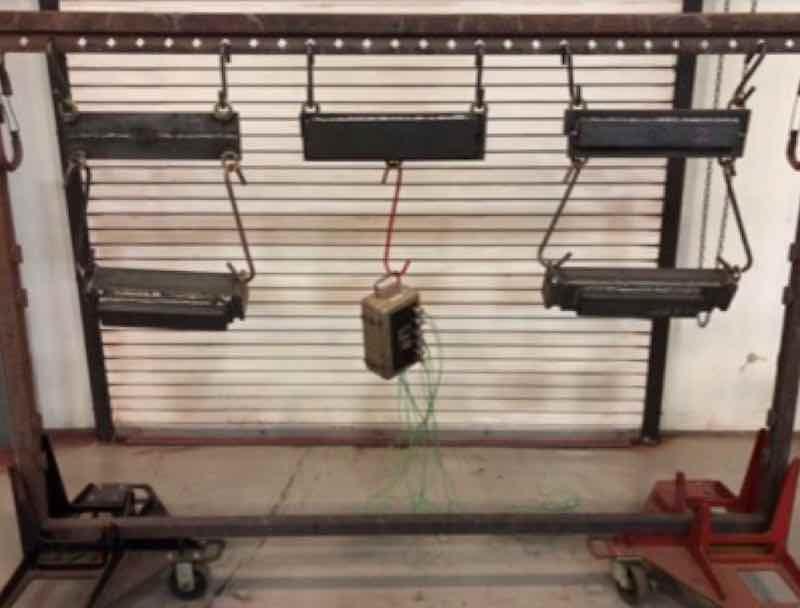
Figure 16: Photo showing test pieces used for experiment
3.4 Design of experiments
The Design of Experiments (DOE) was based on three varying factors: total oven processing time, oven temperature, and material thickness of the part. The main goal of DOE was to optimize the total oven processing time with respect to material thickness and oven temperature. The five test pieces of varying thicknesses, as previously described, were processed through the oven for a total of nine times; three separate tests performed at the current cycle time of 40 minutes, three separate tests performed at a 38 minute cycle time, and three separate tests performed at a 36 minute cycle time. Due to the process limitations of the current paint line, the paint oven is limited to a cycle time of 37 minutes and longer. This is the result of two aspects of the paint line: the paint booth process has a minimum cycle time of 37 minutes, and parts are moved along the paint line by a series of chains that are linked together. This means that the cure oven is limited to the minimum cycle time of the paint booth. Therefore the 36 minute test was done for two reasons: first is to help determine at what time parts can realistically be processed through the curing oven, and second is to have the information required to justify the resources for improving the mechanics of the paint line should the results show that parts can be processed at a time less than 37 minutes. How parts could be processed at 36 minutes for the experiment will be explained later on in the Test procedure section.
Since this DOE was performed in an industrial facility, the temperature setting of the oven was not one of the factors that the research team had permission to manually change, due to fear of introducing defects in the paint quality of production parts. As such, the ambient air temperature of the paint oven during each test was recorded for analysis purposes, rather than manually adjusting temperature settings. Consequently, the average ambient temperature during each experiment was used as the temperature factor to study the effect of ambient temperature on the paint curing process.
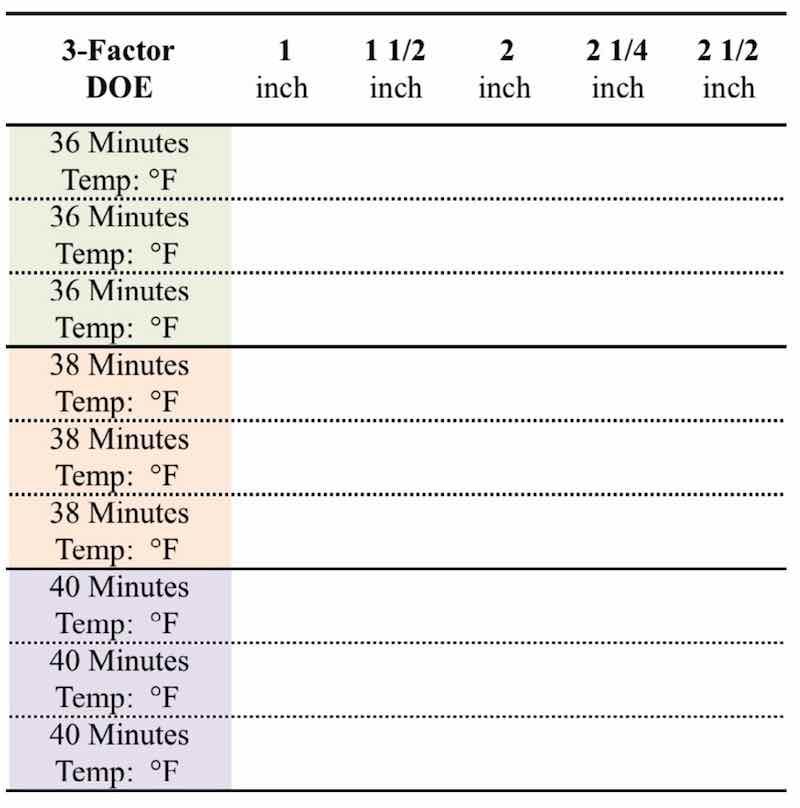
The Datapaq value for each test piece, representing each thickness, was recorded for all nine tests performed. This was the dependent, or the y value that was analyzed in the experiment, as this is the representation of a cured part for the experiment. As stated previously, a Datapaq value of 150 and above would represent a cured part, and values lower than 150 would be considered uncured. The recorded results of all tests were recorded in Table 3 shown below. The Datapaq values for their corresponding thicknesses were recorded in the empty cells, and the average observed ambient temperature was recorded for each test in the Temp: location.
Table 3: Design of Experiments table.
3.5 Test procedure
The testing procedure for the DOE consisted of several steps. First to ensure the equipment used in the tests was calibrated, and working normally to produce consistent results. The second step was to coordinate tests with the paint line operator to assist in the performance of the tests without slowing down the actual part production line. A day before all tests the operator was informed of upcoming test next day, so that the paint cure facility was ready for testing. A typical day in the industrial paint production line consists of loading production parts on load bars for powder coating. On the day of a test, the operator would select one load bar on the paint line to be only partially loaded. This partially loaded bar would then be processed through the paint line along with other load bars fully loaded with production parts. While the partially loaded bar was being processed through the paint line, the DOE test samples were prepped for testing. After the partially loaded bar exited the paint room, the operator would stop the partially loaded bar to allow for the test pieces to be loaded onto load bar. An example of the DOE test pieces hooked onto the load bar outside the paint cure oven is shown below in Figure 17. Once all the pieces were loaded, the Datapaq was started and sealed in the insulated capsule, which was then loaded onto the same load bar as well. After the Datapaq was loaded, the operator would then allow the load bar to be processed through the paint-curing oven. As stated previously, three curing times of 36, 38, and 40 minutes were investigated. For the tests at curing times of 36 and 38 minutes, the operator would release the load bar 4 minutes and 2 minutes earlier than the current cycle time of 40 minutes, respectively, by overriding the timing system in the oven. Then the paint line passes through the cooling tunnel before dismounting the production parts. After the test load bar exited the cooling tunnel, the test pieces were removed and the Datapaq was stopped. The Datapaq was then connected to the computer, and the time/temperature data recorded by the Datapaq was downloaded for analysis. This procedure was used for all tests performed in this research. Consistency of test procedure, accuracy of the data collected, and reliability of the results obtained were of utmost significance during the entire course of this research.
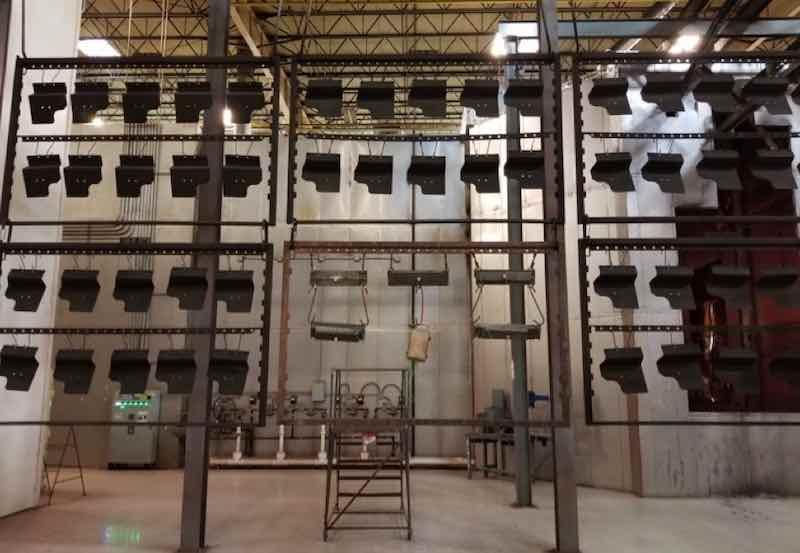
Figure 17: Test pieces on load bar
3.6 Paint Quality Verification Experiments
To ensure that a recommended cycle time from the collected DOE results did not create quality defects, a set of verification tests was performed. These tests consisted of both temperature data collection for the Datapaq value, as well as paint quality testing. For verification purposes, 13 test pieces at each thickness were developed, with the thicknesses remaining the same as the DOE. One piece of each thickness was reserved for Datapaq collection and analysis. The remaining 12 pieces were painted, 4 pieces at the 3 time ranges used for the DOE and tested for paint quality.
The paint quality tests consisted of 2 forms: surface hardness of the paint, and adhesion of the paint to the metal surface of the product. The paint hardness test was done using the pencil hardness test, which is shown below in Figures 18. This test consisted of a 5-pound block with wheels on the back end, and a pencil of a specified graphite hardness inserted at a 45 degree angle. The pencil hardness for these tests is ranked from softest to hardest as the following: 6B-B, HB, F, H-9H. The standard hardness requirements for the facility states that the paint hardness must pass at the H rating. For purposes of the experiment, all hardness tests were performed until failure.
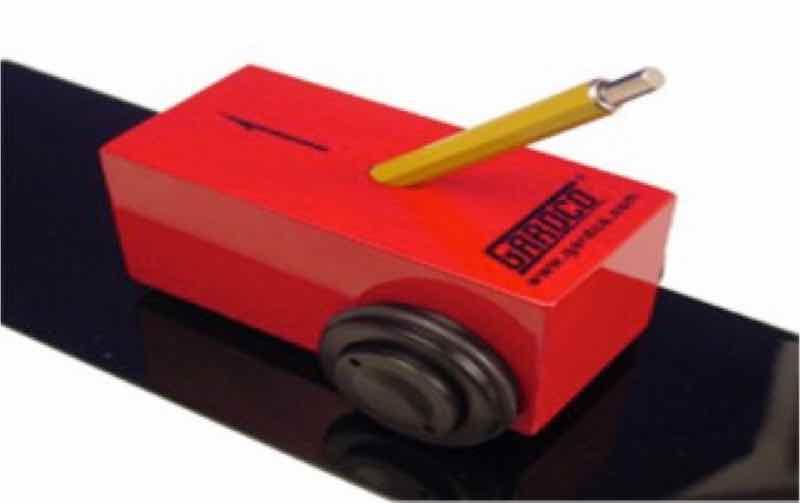
Figure 18: Pencil Hardness Tester
The paint adhesion testing was done using the crosshatch adhesion test shown in Figure 19. This testing method involves the use of a saw tooth like knife to cut into the paint. The blade is pressed into the surface of the paint with enough force to cut down to the raw material, and then it is pulled across a small area to cut parallel grooves. This is then repeated with the grooves perpendicular to the previous grooves made. This creates the crosshatch pattern in the paint. After both the horizontal and vertical cuts have been made, a piece of tape is firmly pressed onto the crosshatch. The tape is then removed and analyzed to see if any paint was removed. If the part did not adhere correctly, pieces of the cut paint will stick to the tape and be pulled from the material when the tape is removed. The adhesion rating ranges from 1 to 5 based on the amount of paint that is removed from the material, with 1 being almost all of the paint peeling off and 5 being none of the paint peeling off. An example of adhesion rating of 2 in which a good portion of paint is scratched or removed is shown in Figure 20. For the purposes of this experiment, only a rating of 5 would be considered a cured part.
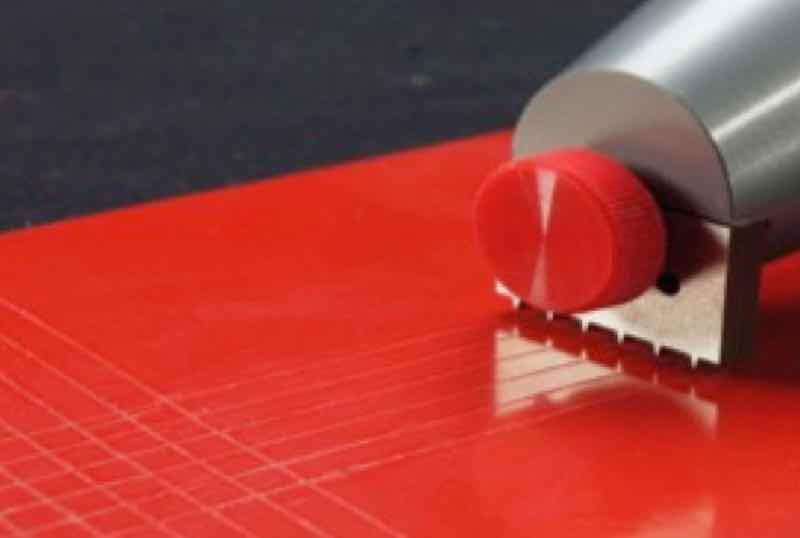
Figure 19: Crosshatch Adhesion Test
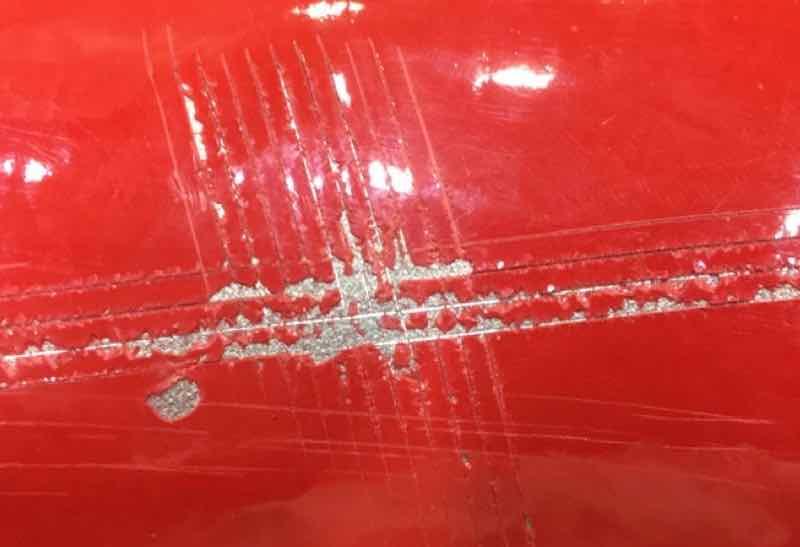
Figure 20. Example of paint adhesion rating of 2
4. Results
After performing all DOE tests, the values of time, temperature, thickness of the workpiece, and Datapaq values were entered into Minitab to perform a 3-factor ANOVA. The results of the DOE are shown in Table 4. This table shows the inputs of the three variables: time temperature, and plate thickness. The first column shows the input variables Time and Temperature, while the first top row in bold shows the plate thicknesses ranging from 1” to 2.5” in thicknesses. The first column also shows three sets of paint cure times (36 min, 38 min, 40 min) at different temperatures ranging from 405 F to 435 F. The rest of the numbers to the right of column one are the corresponding outputs for various plate thicknesses shown in top row. These outputs are the Datapaq values collected for each test piece of given thickness exposed to a certain temperature for a predetermined amount of time.
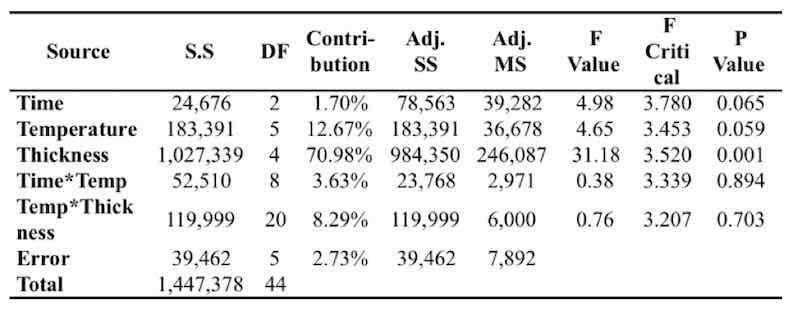
The results of the ANOVA are shown in Table 5. From this table, there are a few things that can be concluded. First is that the major contributing factor to how a part cures is the thickness of the part, or for many parts, the area of largest thickness. Thickness of the part was shown to have a p-value of 0.001, and an overall contribution to the Datapaq value of just over 70%. The second highest contributing factor was shown to be the temperature of the oven, with a p-value of 0.059 and an overall contribution to the Datapaq value of 12.67%. From this it can be concluded that the time spent in the oven could be changed.
Table 4: Design of Experiments Test Matrix
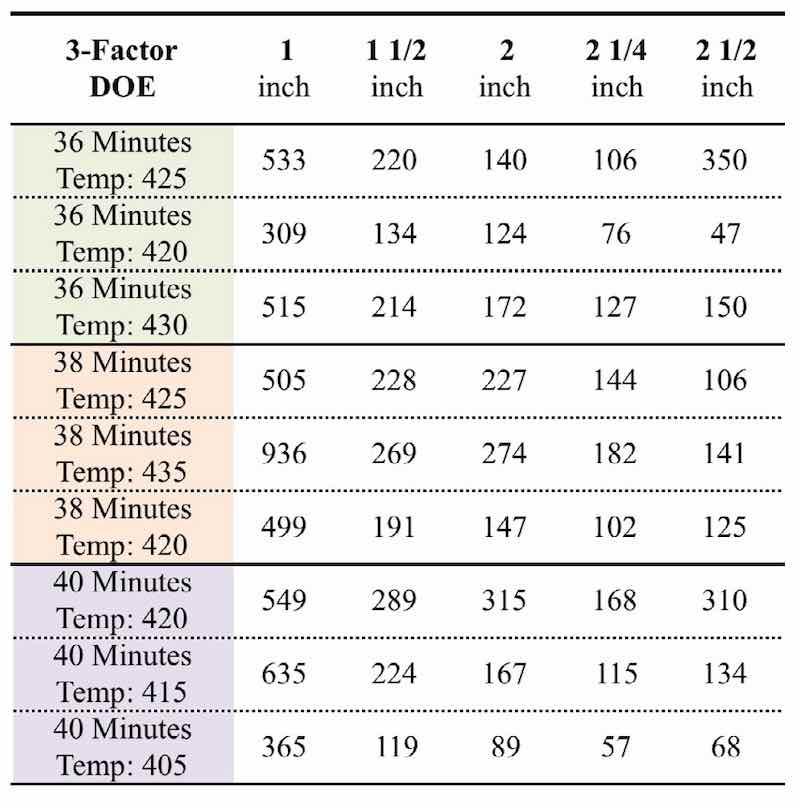
Table 5: ANOVA Results
To accompany the results of the ANOVA, an optimization chart was developed in Minitab. The optimization chart shows what values of time, temperature, and thickness combine to reach the desired Datapaq value of 150. This chart is shown below in Figure 21. This chart is developed in Minitab by organizing the inputs vertically in individual columns according to the Datapaq values that could be associated with each factor. It then takes the target output (Datapaq value) and finds what is the optimal setting from each column that will reach this minimum setting. From this chart it was concluded that parts of thickness 2 ¼ inch could be processed at 38 minutes given an average oven temperature of 430 degrees F. However, from the results of the DOE testing, an average oven temperature of 430 degrees F and above occurred in only 2 of the 9 tests performed. An average temperature of 420 degrees F and above was recorded for 7 of the 9 tests. Therefore, another optimization chart was produced with the temperature set at 420 degrees F. This chart is shown in Figure 22. This chart shows that given the oven temperature of 420 degrees F, parts of 2 inch thickness can be processed at 38 minutes and obtain a Datapaq value of 150.
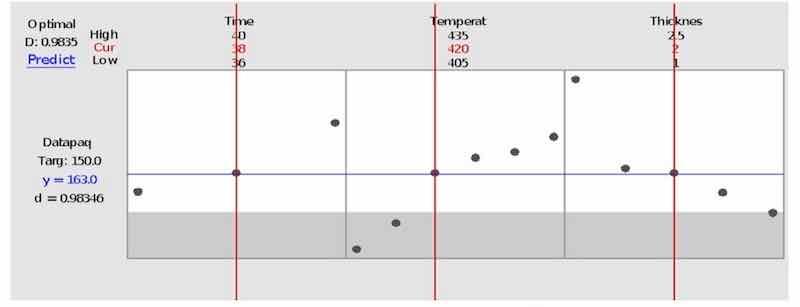
Figure 21: Optimization Chart
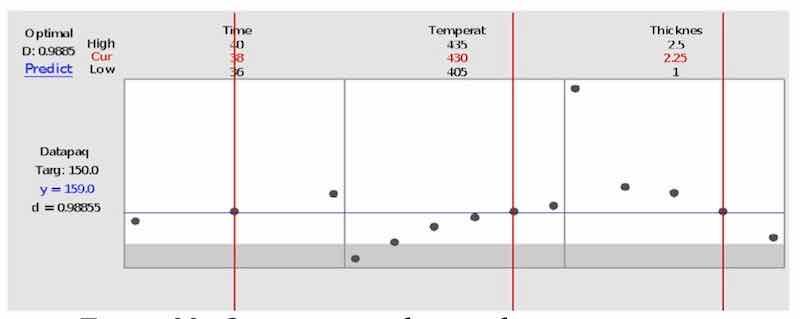
Figure 22: Optimization chart with set temperature
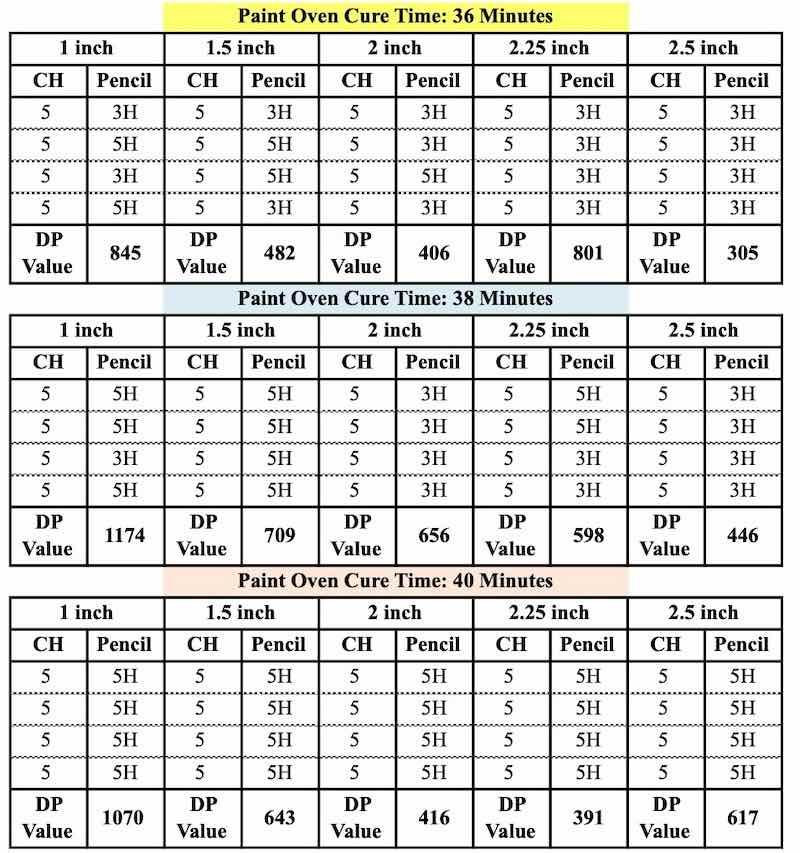
The results of the paint adhesion Cross Hatch (CH) Test and paint hardness Pencil test are shown in Table 6, for different plate thicknesses and curing times together with the corresponding Datapaq (DP) values. At each condition 4 parts were tested and the corresponding CH and Pencil values recorded. CH value of 1 means almost all of the paint peeled off, and 5 means none of the paint peeled off. The pencil hardness tests are ranked from softest to hardest: 6B-B, HB, F, H-9H, with H being the facility standard to pass hardness requirement. From Table 6 it is clear that all samples passed adhesion and hardness test. Thus all parts could be processed at the lowest time of 36 minutes without producing paint quality defects. These results not only demonstrate that parts could be realistically processed in 36 minutes without paint defects but also provide data to justify the resources for improving the mechanics of the paint line for processing the parts at a time less than 37 minutes. Furthermore, there does not seem to be a strong relationship between the time spent in the oven and the adhesion of the paint to the part. Parts cured at 36 minutes achieved the same rating of adhesion as parts cured at 40 minutes. However, parts processed at 36 minutes achieved a lower rating of hardness than those processed at 40 minutes. This leads to the hypothesis that time spent in the oven does have an affect on the hardness of the paint; whereas the adhesion is based on whether the part reached the required temperature that needs further investigation.
Table 6: Paint Quality Verification results
5. Discussion of Results
From the results of the experiment, there are several recommendations that can be made. The first recommendation is that the cycle time for parts of 2 inch thickness and under can be processed at 38 minutes, rather than the current 40 minutes. To support this recommendation, it is also recommended that control devices be installed to streamline the new cycle time. These devices would consist of several items. The first item would be a barcode reader installed before the cure oven. This would read the identity of the load bar and signify whether it is a 38 minute load bar or not. These different times would be input by additional coding installed at the load station. This coding would provide a button on the control panel that the operators would press if a load bar had to be processed at a time greater than 38 minutes, given that the standard cycle time of the cure oven would be set at 38 minutes. Along with the coding at the load station would be similar coding on the master control panel. This would allow the head operator to adjust the cycle time of any load bar should any mistakes be made at the load station, or a different cycle time be needed.
The last recommendation to make is that additional experiments be performed on the cure oven to ensure consistent curing of products. Throughout the experiment, there were some concerns about the variation in the average temperature of the various tests performed. Through inquiry, there could be a number of issues including: positioning of temperature probes in the oven, output differences of the 3 burners supplying heat to the oven, and the method in which material moves through the oven. While the experiment does support that the cycle time of the oven can be reduced without creating quality defects, reducing the variation in the oven will provide the basis to be able to reduce this cycle time as well as reduce level of defects. Therefore, additional quality experiments should be performed to reduce the temperature variation in the paint oven.
6. Discussion of Capstone Design
As stated in the introduction, the research and experimentation of this article was the result of a senior capstone research project facilitated by Bradley University to fulfill requirements for ABET accreditation. While the project directly impacts the facility in which the experimentation was performed, the project also provided both essential and non-essential outcomes to the senior capstone design course. The first essential outcome that was a result of this project was that it presented the students with a real world industrial problem to solve. This was a perfect example of a typical process improvement project that can be replicated by companies across many different industries. The second essential outcome resulting from the completion of this project was the culmination of knowledge from various courses taken throughout the four year undergraduate education into one project. Developing, performing, and finalizing this experiment took a wealth of knowledge gained through prerequisite classes leading up to senior capstone design, and ultimately graduation. Examples of this include, but are not limited to: use of an advanced statistical tool such as DOE and ANOVA, understanding of welding processes used throughout industry, time studies, and understanding of material properties. The last essential outcome of senior capstone that was the resultant of this project was that it gave members the proper exposure to be able to hit the ground running, when they join the industry upon graduation. For several of the team members, it gave the experience needed to have a competitive edge, and ultimately become gainfully employed as engineers.
Throughout this experimental project, there were also learning outcomes that were not a requirement of senior capstone but were nevertheless a resultant of performing the project. The first of these is that one of the team members learned how to MIG weld and got to a level of proficiency high enough to make some of the test pieces. Many engineers, regardless of discipline, do not have experience welding, unless they independently took welding courses. This is the same case for engineers in the IMET department at Bradley University, as the only welding experience that Industrial or Manufacturing engineers receive is two 1-hour labs on stick welding that is meant to merely introduce the student to what welding is. However, there was both a large amount of welding to be done for this project, and a wealth of knowledge to be collected from the welding operators in this facility. Between both factors, one of the team members gained about 10 hours of welding experience along with advice and guidance through multiple sources throughout the facility. Another non-essential learning outcome that resulted from the project took the form of gaining extensive knowledge on the industrial painting process and the application of powder coat paint. As stated in the introduction, painting of parts, specifically steel, is common throughout multiple industries. Gathering a thorough understanding of one of the most common forms of industrial painting can provide an incredible competitive edge when applying for positions in a manufacturing environment.
7. Conclusion
- Results of the DOE show that time spent in the oven is not a large contributing factor.
- When oven temperature is held at an average of 420F, optimization charts show that parts at and below 2-inch thickness can be processed in 38 minutes.
- Reducing cycle time by 2 minutes will provide a 5% increase in productivity, and a 5% decrease in energy consumption per load bar.
- Verification testing corroborates the results of the DOE, as parts processed at the desired 38 did not show signs of quality defects.
- Additional control devices should be installed on the paint line to streamline the new cycle time
- Cure oven showed signs of unfavorable variation.
- Additional quality experiments should be performed on the cure oven to ensure proper paint quality.
- This project not only produced well-trained workforce ready to hit the ground running but also was also successful in gainful employment of its members.
Noah Glick is with Case New Holand Industrial in Goodfield, Illinois; Iqbal Shareef is with Bradley University in Peoria, Illinois.
Acknowledgements
The authors are highly thankful to CNH Industrial for its support of student led experimental projects in their facilities. The authors would also like to thank the following staff members of the Case IH facility: Brian Hansche for inviting Bradley students into his plant, Chris Martin for facilitating Bradley projects, Josh Larson for providing leadership and insight throughout the duration of experimentation, and Brandon Curran and Darrel Ellis for their flexibility on the paint production line and allowance of experimentation. Additionally, the authors would like to thank the members of the capstone design team: Nathan Scachette, Reid Kendryna, and Jacob Pawelkiewicz, for their help in developing test pieces and collecting experimental data. Lastly the authors would like to thank Dr. Lex Akers, Dean of Caterpillar College of Engineering Technology for his support of publication of Bradley’s Capstone Projects.
References
1. Wood, E., 2009. AP European History: Chapter 20: The Industrial Revolution and Its Impact on European Society, Wood Yard Publications, pp. 582-608.
2. Editors: History.com, “Industrial Revolutions,” A&E Television Networks, 29 October, 2009, www.history.com/topics/industrial-revolution/industrial-revolution
3. Holstein, William K., and Morris Tanenbaum. “Mass Production.” Encyclopedia Britannica, Encyclopedia Britannica, Inc., 28 Jan.2019, www.britannica.com/technology/mass-production.
4. Gubbi, J., Buyya, R., Marusic, S. and Palaniswami, M., 2013. Internet of Things (IoT): A vision, architectural elements, and future directions. Future generation computer systems, 29(7), pp.1645-1660.
5. Lasi, H., Fettke, P., Kemper, H.G., Feld, T. and Hoffmann, M., 2014. Industry 4.0. Business & information systems engineering, 6(4), pp.239-242.
6. Lee, J., Bagheri, B. and Kao, H.A., 2015. A cyber-physical systems architecture for industry 4.0-based manufacturing systems. Manufacturing letters, 3, pp.18-23.
7. Zhong, R.Y., Xu, X., Klotz, E. and Newman, S.T., 2017. Intelligent manufacturing in the context of industry 4.0: a review. Engineering, 3(5), pp.616-630.
8. Businesswire.com. (2018). Outdated Education and Workplace Training Put at Risk US$11.5 Trillion in Growth Promised by Intelligent Technologies [online] https://www.businesswire.com/news/home/2018091900 5051/en/Outdated-Education-Workplace-Training-Put-Risk-US11.5
9. Judy, R.W. and D'amico, C., 1997. Workforce 2020: Work and workers in the 21st century. Hudson Institute, Herman Kahn Center, PO Box 26-919, Indianapolis, IN 46226.
10. Gilley, K.M., Greer, C.R. and Rasheed, A.A., 2004. Human resource outsourcing and organizational performance in manufacturing firms. Journal of business research, 57(3), pp.232-240.
11. Markes, I., 2006. A review of literature on employability skill needs in engineering. European Journal of Engineering Education, 31(6), pp.637-650
12. Stone, K.B., Kaminski, K. and Gloeckner, G., 2008. Closing the gap: Education requirements of the 21st century production workforce. Journal of STEM Teacher Education, 45(3), p.4.
13. Davis, J., Edgar, T., Porter, J., Bernaden, J. and Sarli, M., 2012. Smart manufacturing, manufacturing intelligence and demand-dynamic performance. Computers & Chemical Engineering, 47, pp.145-156.
14. Schrock, G., 2013. Reworking workforce development: Chicago’s sectoral workforce centers. Economic Development Quarterly, 27(3), pp.163-178.
15. Tan, K.H., Denton, P., Rae, R. and Chung, L., 2013. Managing lean capabilities through flexible workforce development: a process and framework. Production Planning & Control, 24(12), pp.1066-1076.
16. D'Amico, M.M., Morgan, G.B., Katsinas, S.G. and Friedel, J.N., 2015. State director views on community college workforce development. Career and Technical Education Research, 39(3), pp.191-211.
17. McAneney, T.B., Loutfy, R.O., Mammino, J., Nichol-Landry, D.J. and Sypula, D.S., Xerox Corp, 1987. Powder coating process for seamless substrates. U.S. Patent 4,711,833.
18. Akafuah, N.K., Poozesh, S., Salaimeh, A., Patrick, G., Lawler, K. and Saito, K., 2016. Evolution of the automotive body coating process—A review. Coatings, 6(2), p.24.
19. Point, M.A., Sames Sa De Machines Electrost, 1970. Multilayer coating process U.S. Patent 3,513,012.
20. Shaw, L.E. and Jarvis, H.F., 1975. Electrostatic powder coating process. U.S. Patent 3,904,346.
21. Sakakibara, T. and Okazaki, H., Dai Nippon Toryo KK, 1981. Process for forming multi-layer coatings. U.S. Patent 4,268,542.
22. Parthasarathy, M.R., Nethersole, D.C. and Dudley, M.A., Canada Wire and Cable Co Ltd, 1978. Thin walled protective coatings by electrostatic powder deposition. U.S. Patent 4,104,416.
23. Schlegel, G.E., Mill, G.R. and Horinka, P.R., Morton International LLC, 2001. Process for coating cabinet doors. U.S. Patent 6,268,022.
24. Sankaran, S. and Missing, A.W., 1995. Combined coil and blank powder coating. U.S. Patent 5,439,704.
25. Biller, K.M. and MacFadden, B.A., Herberts Powder Coatings Inc, 1998. Radiation curing of powder coatings on heat sensitive substrates: chemical compositions and processes for obtaining coated workpieces. U.S. Patent 5,789,039.
26. Metzger, W.A., Metzger Wesley A, 1982. Apparatus and process for drying and curing coated substrates. U.S. Patent 4,336,279.
27. Nelson, J.S., Angell, S.L., Mannerud, J.E. and Bergman Jr, C.H., BGK Finishing Systems Inc, 1990. Automotive coating treating process. U.S. Patent 4,943,447
28. Petrie, Edward M. “Fundamentals of Paint Adhesion.” Materials Today, 23 Apr. 2018, www.materialstoday.com/metal-finishing/features/fundamentals-of-paint-adhesion.